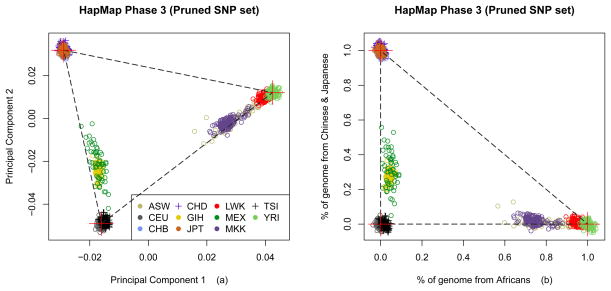
Figure 3.
The principal component analysis on HapMap Phase 3 data, using a pruned set of 9,949 SNPs and 1,198 founders consisting of 11 populations: a) the first and second eigenvectors; b) a linear transformation of coordinate from a) followed by a translation, assuming three ancestral populations with surrogate samples: CEU, YRI and CHB+JPT. The average positions of three surrogate samples are masked by a red plus sign.

