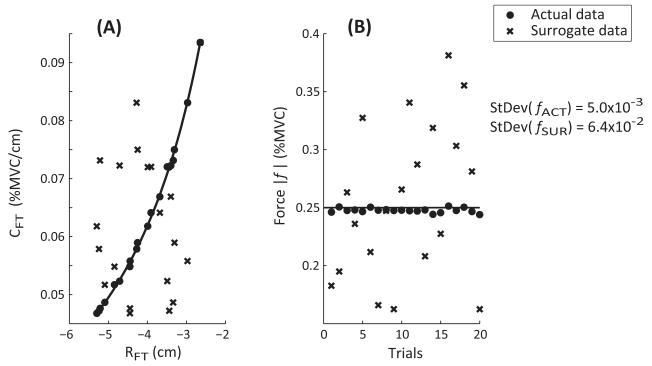
Figure 4.
Generation of surrogate data. Panel (A) shows a set of twenty {RFT; CFT} pairs for one finger condition (data is pooled across the hands) as the solid dots that align with the hyperbolic curve. The surrogate data {RFTsur; CFTsur} obtained by permuting RFT and CFT are depicted as crosses. Panel (B) depicts the actual forces obtained from the original data set as solid dots, and the surrogate forces obtained from the permuted data as crosses. The standard deviation (StDev) in the original forces is lower than that in the forces generated using the surrogate data (fsur).

