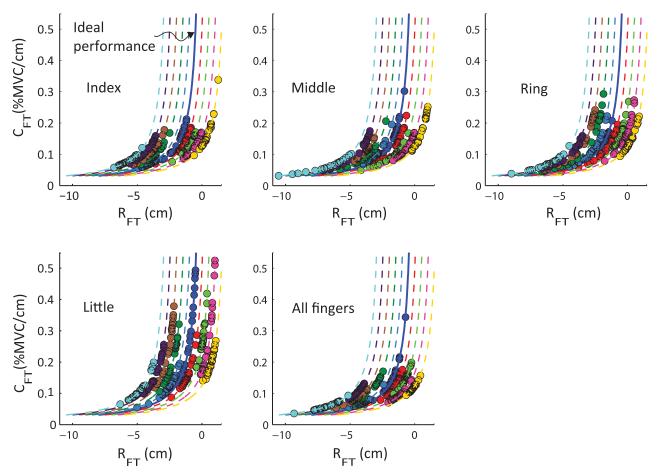
Figure 6.
The referent fingertip position RFT is plotted against the apparent stiffness CFT for each finger condition. Data is poled across all subjects. The data for nine subjects are displaced horizontally along the RFT axis to illustrate the spread for each subject. The dashed lines are linearly-displaced replicates of the hyperbola for ideal performance (the solid curve): RFT × CFT = −0.25.

