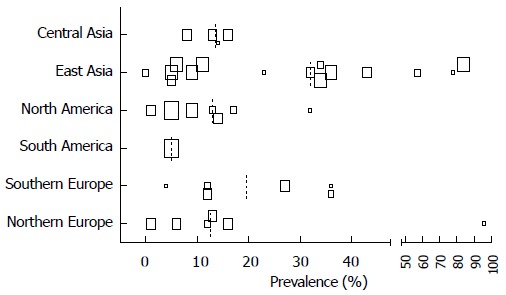
Figure 4.

Prevalence cytomegalovirus infection in different global regions by authors definition. Size of the squares corresponds with the population size in 5 categories (n = 0-25, n = 25-50, n = 50-100, n = 100-250, n > 250). Median depicted as dotted line.
