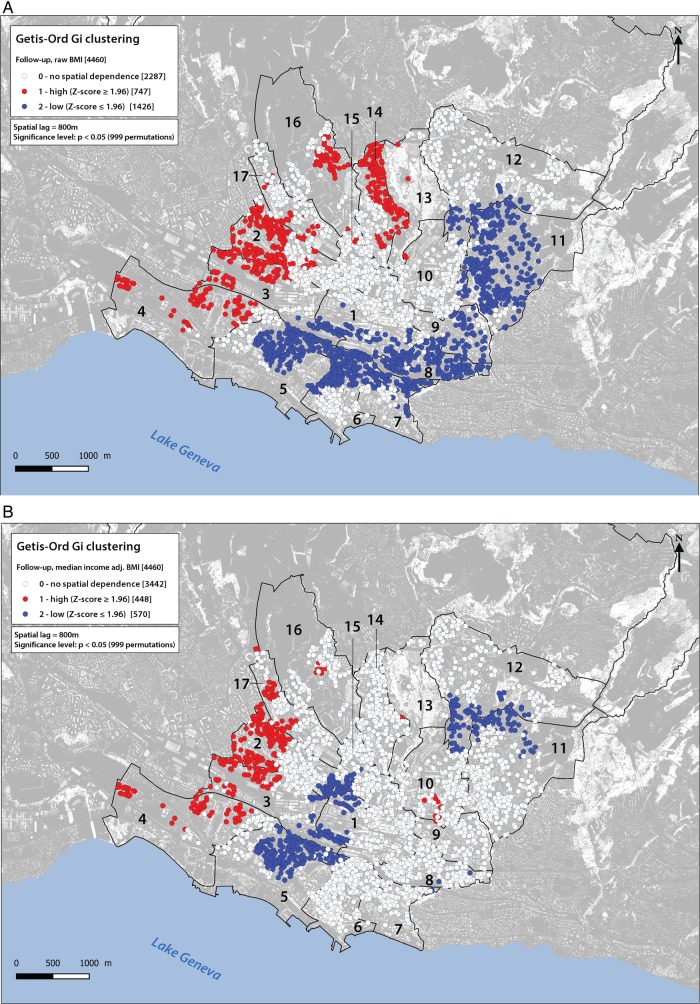
Figure 2.
Clusters for follow-up showing the raw body mass index (BMI) (A) and the BMI adjusted for median income (B). White dots show sampling places where the space is neutral (no spatial dependence). Red dots show individuals with a statistically significant positive Z score (α=0.05), meaning that high values cluster within a spatial lag of 800 m, and are found closer together than expected if the underlying spatial process was random. Blue dots show individuals with a statistically significant negative Z score (α=−0.05), meaning that low values cluster within a spatial lag of 800 m, and are found closer together than expected if the underlying spatial process was random. Lausanne districts are numbered from 1 to 17. For an exact description of the limits of the districts see online supplementary figure S1. The background of the map was built on the basis of LIDAR data (height's model, Source: Géodonnées Etat de Vaud, 2012).

