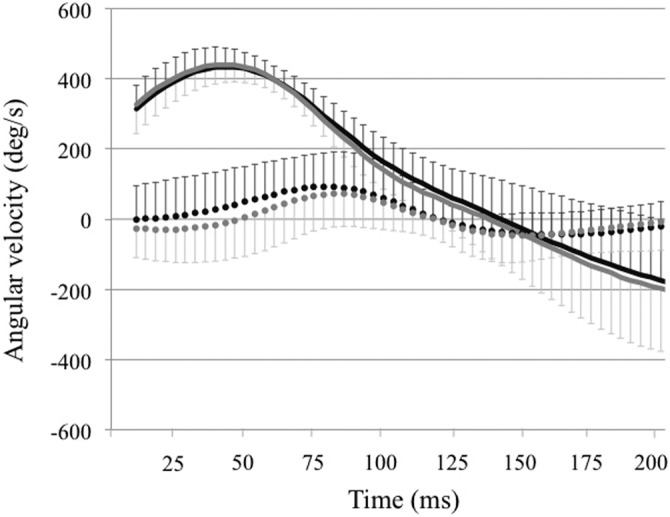
Figure 2.

Means and standard deviations of knee flexion (solid lines) and adduction (dotted lines) velocities prior to (black line) and after (gray line) the fatigue protocol. Knee flexion and adduction angular velocities are indicated with positive values, while knee extension and abduction angular velocities are indicated with negative values.
