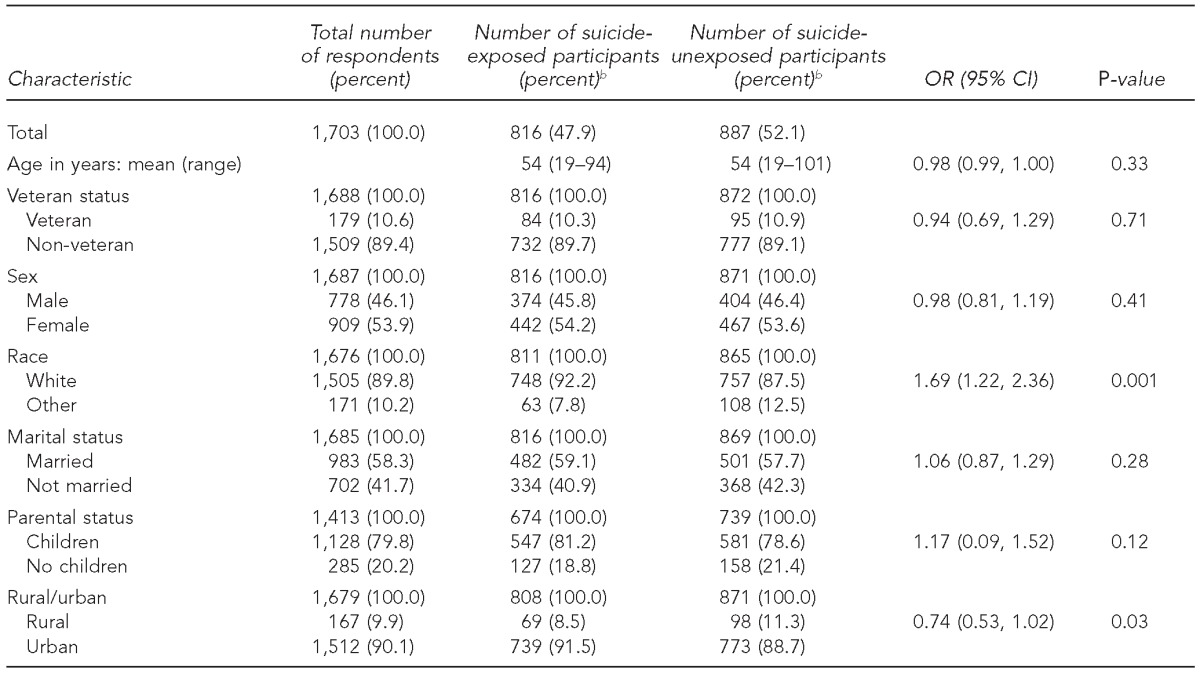
Table 1.
Comparison of characteristics of suicide-exposed and suicide-unexposeda participants in a random-digit-dial survey, Kentucky, July 2012–June 2013a

Frequency counts based on total number of recipients who answered each item under analysis.
bProportions are weighted and incorporate sampling weights.
OR = odds ratio
CI = confidence interval
