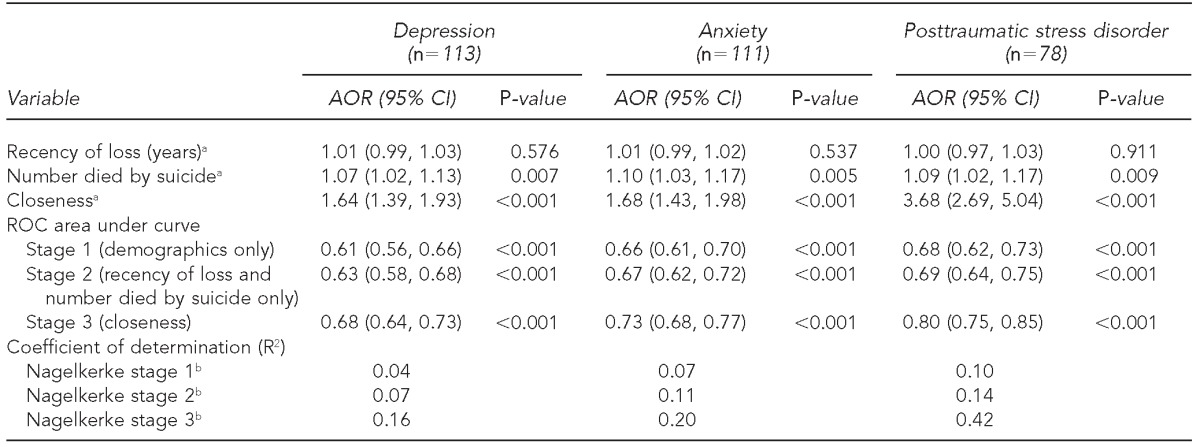
Table 3.
Adjusted odds of depression, anxiety, and posttraumatic stress disorder for suicide-exposed individuals, by recency of loss, number known who died by suicide, and perceived closeness, in a random-digit-dial survey, Kentucky, July 2012–June 2013

NOTE: All data weighted. Analyses were conducted on both weighted and unweighted data with similar results. Weighted coefficients are reported. All coefficients reported are from final stage (stage 3) of the analysis. Covariates were veteran status, age, sex, race, and rural/urban status.
aRecency of loss is defined as the number of years since the suicide that affected the participant the most. Number died by suicide is the total number of suicide exposures reported by the participant. Closeness is defined as the level of perceived closeness to the suicide decedent on a scale from 1 to 5.
bNagelkerke measurements denote amount of variance explained per stages 1–3 of each model.
AOR = adjusted odds ratio
CI = confidence interval
ROC = receiver operator characteristic
