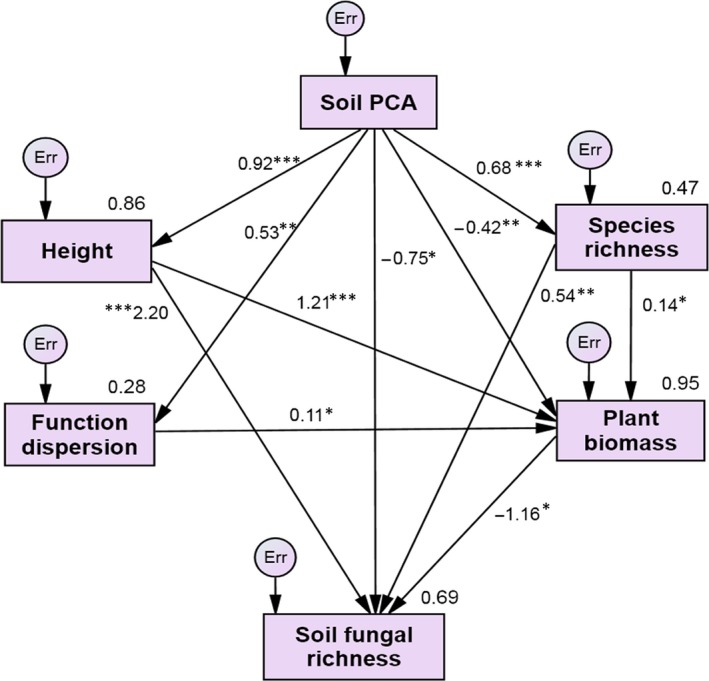
Figure 4.

Final structural equation model with standardized direct effects. Standardized regression weights (along path) and total variance explained as a result of all predictors pointing to that variable (top right corner of rectangle). Single‐headed arrows represent direct effects. *, **, and *** indicate statistically significant paths at P < 0.05, P < 0.01, and P < 0.001, respectively.
