
Figure 4.
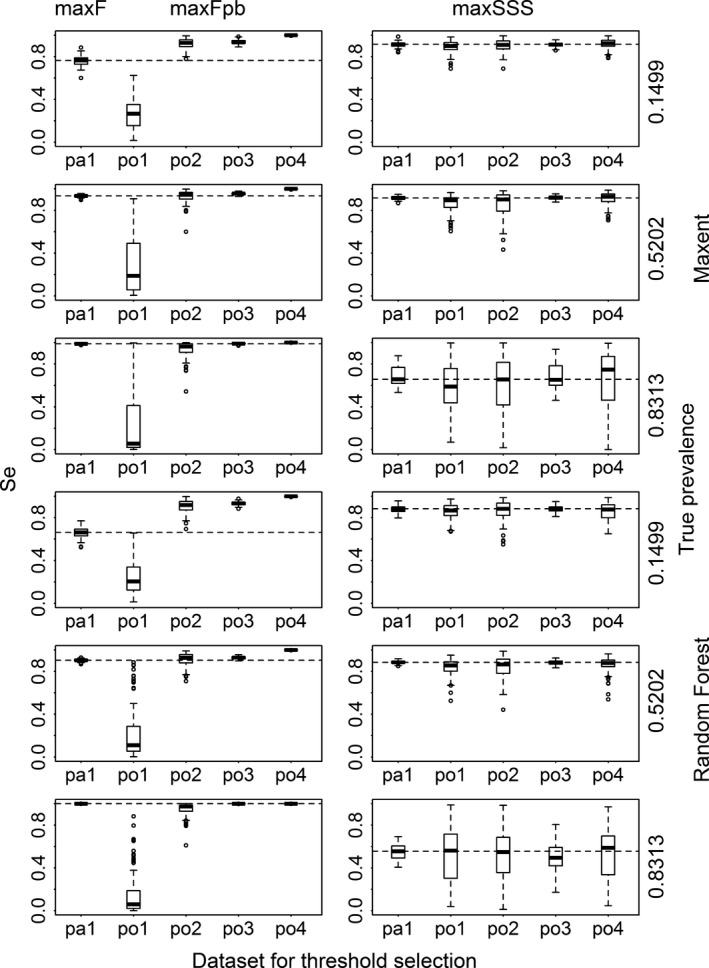
Sensitivity (Se) calculated for the results transformed with the thresholds selected using maxF with presence/absence dataset (pa1), using maxF pb with four presence‐only datasets (po1, po2, po3, and po4) and using maxSSS with all the five datasets for Maxent and Random Forest models for three virtual species with low, intermediate, and high prevalence. The dashed lines correspond to the median sensitivity of those using maxF and maxSSS with pa1.