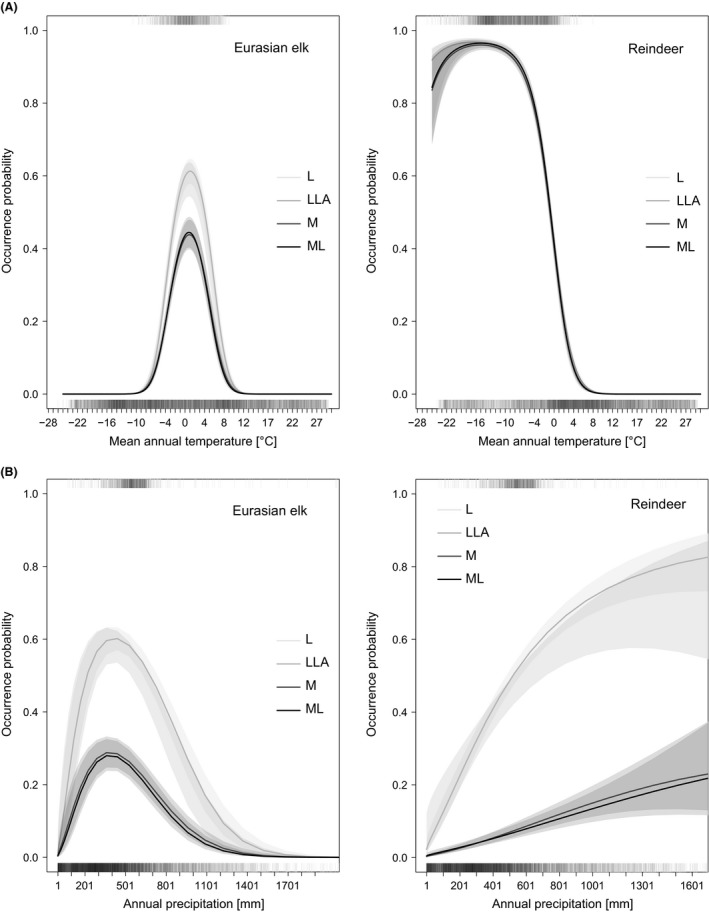
Figure 5.

Climate response curves of Eurasian elk (left) and reindeer (right) with respect to temperature (top) and precipitation (bottom) from four different model variants. To accommodate the skewness in precipitation, the x‐axis was cut off at 99% of the data. Overlapping 95%‐confidence intervals create heavier shading.
