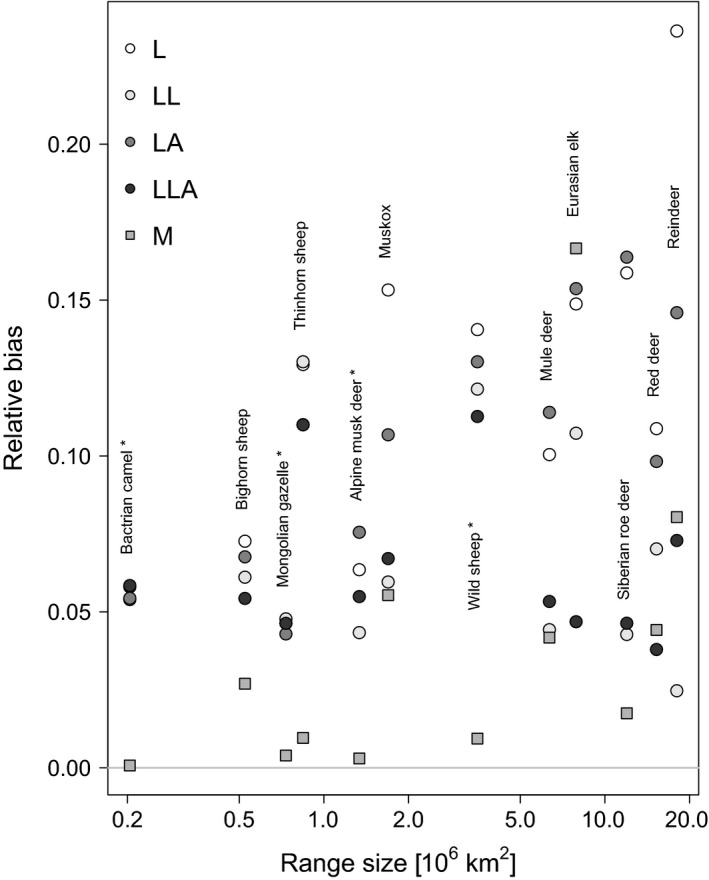
Figure 6.

Relative parameter bias for each model, as a function of species range size. Asterisks behind species names indicate continental species. The increase in bias with log(range size) is significant, as is the difference between projections (circles vs. squares).
