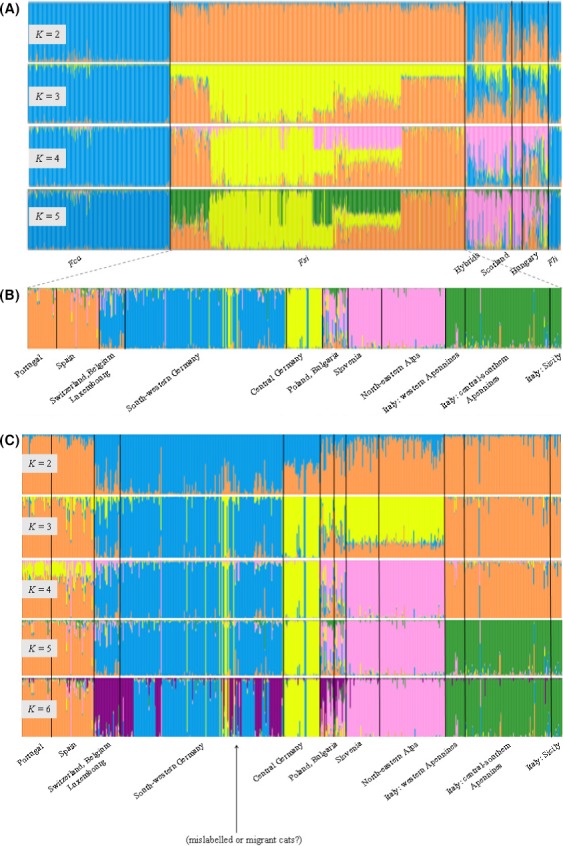
Figure 3.

Bayesian clustering analyses of wildcats and domestic cats genotyped with 31 autosomal microsatellite loci. Clustering was performed in structure (run with the “admixture” and the “F” models; Pritchard and Wen 2003). (A) Assuming K = 2–5, structure shows a major distinction between domestic and wildcats; hybrids and free‐ranging cats sampled in Hungary and Scotland show deeply admixed genotypes. (B) Population clustering assuming K = 5 and showing evidence of five main European wildcat biogeographic groups. (C) Patterns of hierarchical splitting of European wildcat populations assuming K = 2–6. Each cat genotype is represented by a vertical bar split in K colored sections, according to its relative assignment to the K genetic clusters.
