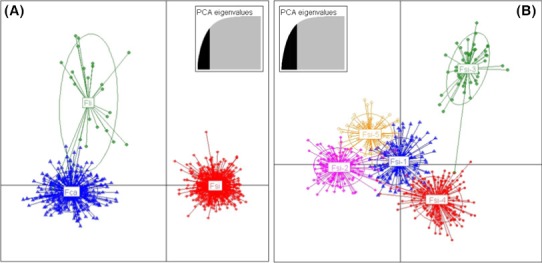
Figure 4.

Discriminant analysis of principal components (DAPC in Adegenet; Jombart et al. 2008). The plots show the clustering patterns of: (A) three Felis silvestris subspecies: Fsi, European wildcat (F. s. silvestris); Fca, domestic cats (F. s. catus); Fli, African wildcats (F. s. libyca); and (B) five European wildcats biogeographic groups identified by Bayesian analyses: Fsi‐1, north‐eastern Alps, Dinaric Alps, Bulgaria, and Poland; Fsi‐2 peninsular Italy, Sicily; Fsi‐3, central Germany; Fsi‐4, south‐western Germany; central Europe including Belgium, Switzerland and Luxembourg; Fsi‐5, Portugal, Spain. Individuals (dots) and populations (colored ellipses) are plotted within the orthogonal space defined by the first two PCA eigenvalues (inserts).
