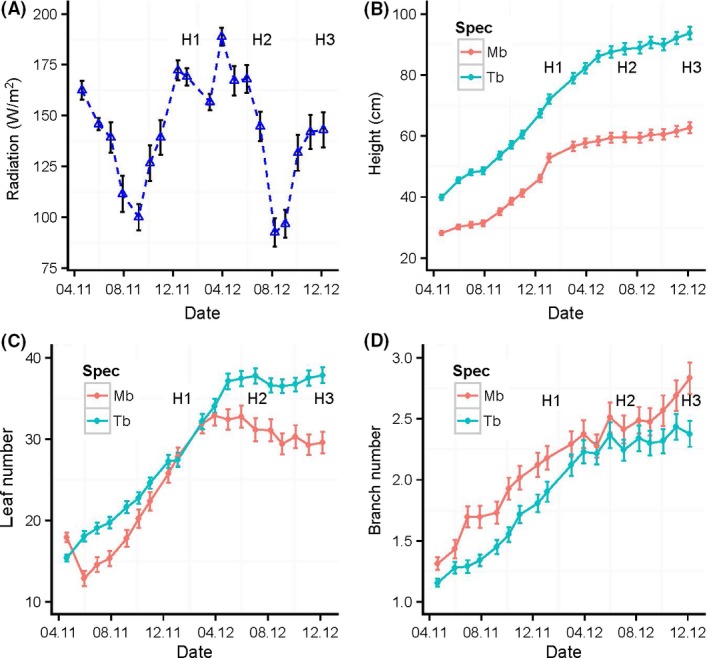
Figure 1.

Variation in radiation during the course of the experiment (A) and the mean growth of Microberlinia bisulcata (Mb) and Tetraberlinia bifoliolata (Tb) in terms of (B) Height, (C) Leaf number, and (D) Branch number, across all treatments and for those plants that were present from start to finish. The labels H1, H2, and H3 indicate the timing of the harvests. Half of these plants (one of the four replicates) contributed to H3 at the end, whilst H1 and H2 used the two other replicates not part of the data presented here. Bars on points are ±1SE.
