
Figure 1.
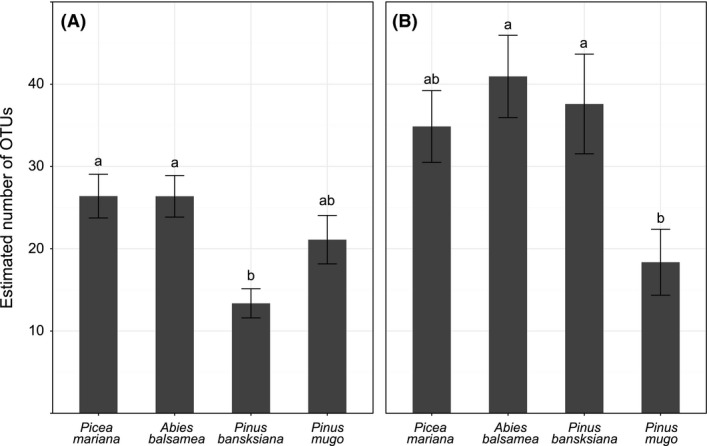
Estimated total OTU richness across the different host species for roots (A) and soil (B) samples. Total richness was evaluated with the Chao estimator. Different letters indicate significant differences among hosts (P ≤ 0.05).
Official websites use .gov
A
.gov website belongs to an official
government organization in the United States.
Secure .gov websites use HTTPS
A lock (
) or https:// means you've safely
connected to the .gov website. Share sensitive
information only on official, secure websites.
Estimated total OTU richness across the different host species for roots (A) and soil (B) samples. Total richness was evaluated with the Chao estimator. Different letters indicate significant differences among hosts (P ≤ 0.05).