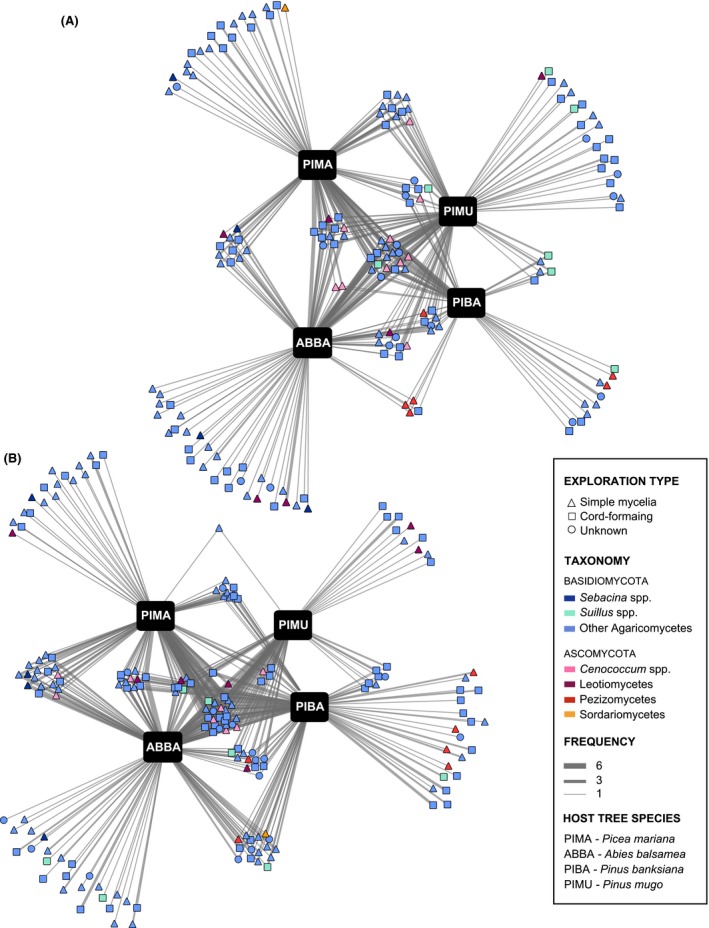
Figure 3.

(A) Roots and (B) bulk soil EM interaction networks. The four hosts are represented by black boxes; EM fungal OTUs are colored according to their taxonomy and their shape indicates exploration type. Edges (i.e., links between EM fungal OTUs and host trees) width is proportional to the frequency of observation.
