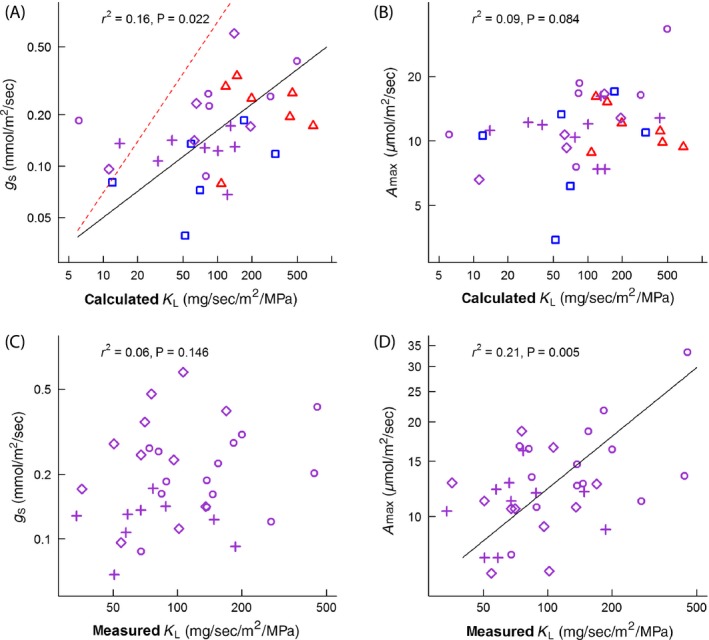
Figure 3.

Relationships between leaf‐specific conductance measurements and gas exchange. Relationship between leaf‐specific conductance calculated from petiole vessel anatomy (calculated K L) and stomatal conductance (g s) (A), and maximal CO 2 assimilation rate (A max) (B). Panels C and D show the same comparison as above, but using leaf‐specific conductance values measured using the rehydration technique (measured K L). Sites are denoted by the following symbols: Tropical‐Monsoonal (▵), Subtropical‐Wet (○), Subtropical‐Dry (♢), Subtropical‐Arid (+), and Temperate‐Dry (□). Symbol color denotes temperature: temperate = blue, subtropical = magenta, tropical = red. Standard major axis trendline (solid black) and broken red line departure in fitted exponent from proportional changes in g s (A). Individual symbols represent species' means. The number and identity of species on each plot may differ depending on the availability of measurements (Supporting information, Trait Data).
