Figure 2.

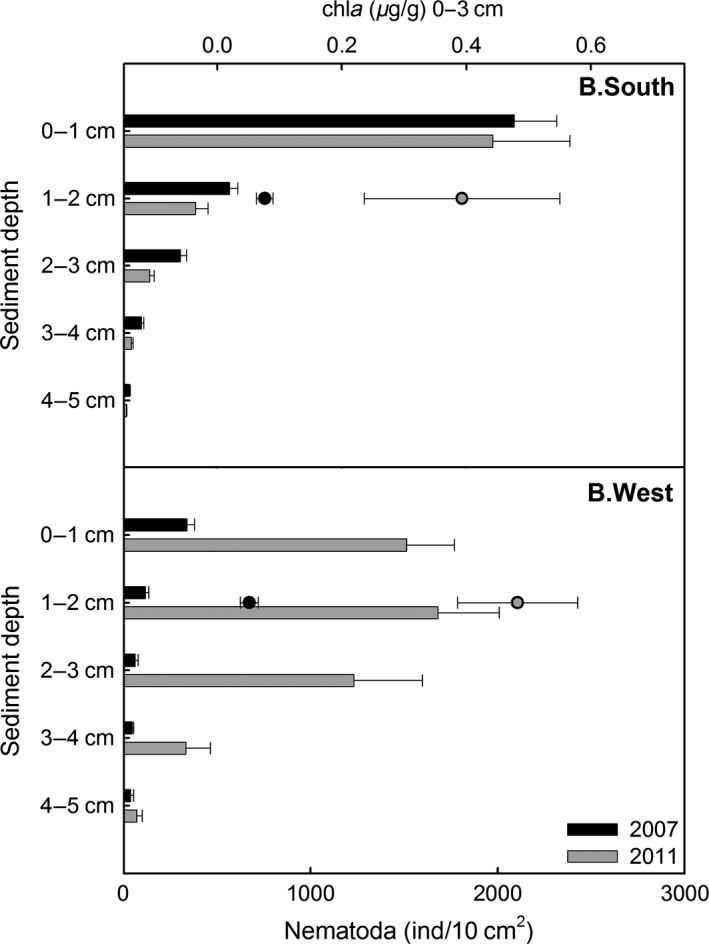
Average vertical nematode abundance (bars) and surface (0–3 cm) chlorophyll a values (dots) at stations B.West and B.South in 2007 (black) and 2011 (gray). Error bars indicate standard error (standard deviation/√number of replicates).

Average vertical nematode abundance (bars) and surface (0–3 cm) chlorophyll a values (dots) at stations B.West and B.South in 2007 (black) and 2011 (gray). Error bars indicate standard error (standard deviation/√number of replicates).