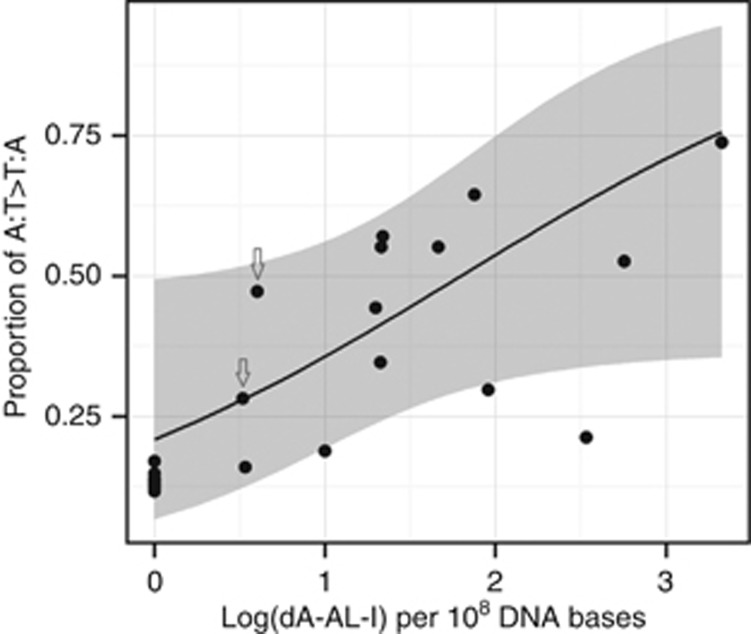
Figure 3.
Proportion of A:T>T:A mutations according to the quantity of DNA adducts 7-(deoxyadenosin-N6-yl) aristolactam I (dA-AL-I) detected in 14 Romanian and 15 non-Romanian renal cell carcinoma cases. The line corresponds to the binomial model fit to the data (log-linear trend P=0.0605). The grey zone indicates the 95% confidence interval around proportions predicted by the model. The arrows point to observed data for the two renal parenchyma samples where glomeruli were not present (when removed from the analysis: P=0.0560). Levels of dA-AL-I were set to zero when below the detection threshold of 0.3 adducts per 108 DNA bases. For Romanian subjects, dA-AL-I levels measured in DNA samples isolated using a phenol/chloroform extraction protocol were used for this analysis. Similar results were obtained using levels measured in DNA extracted using a standard Autopure (Qiagen) protocol.

