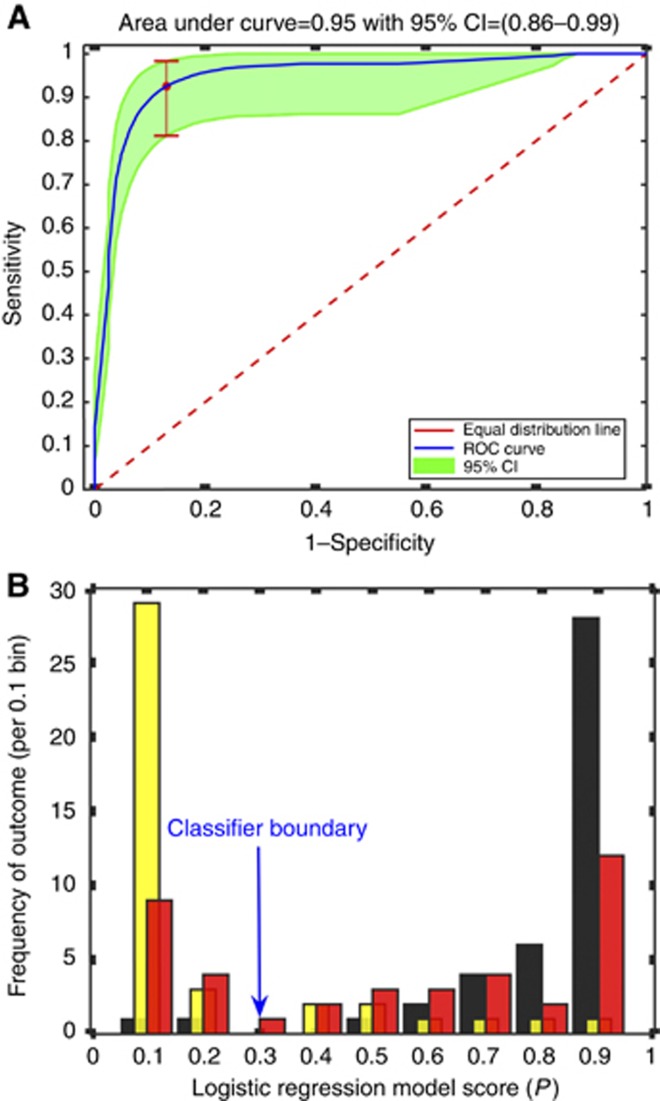
Figure 2.
Three-metabolite logistic regression model. (A) Receiver Operating Characteristic (ROC) curve for GC vs HE comparison based on three-metabolite model. Area under the curve (AUC) is 0.95 (95% CI=0.86–0.99). For a fixed specificity of 80%, the sensitivity is 95% (95% CI=0.85–1.00). (B) Frequency histogram for logistic regression model scores. Yellow bars represent HE patients; red, BN patients; and black, GC patients. The number (frequency) of patients with each score is depicted by the height of the bars. Scores closer to 1 indicate a high probability of GC; close to 0 indicates high probability of HE. Cutoff boundary is score 0.3. Above 0.3, classified as GC; below, not GC.

