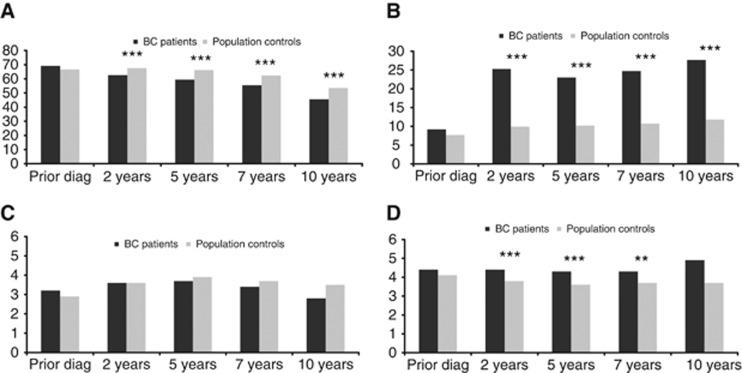
Figure 1.
Prevalence of work-related outcomes in BC survivors and the general population comparison sample in the year prior to BC diagnosis and at 2,5,7 and 10 years of follow-up. (A) % women with income from employment. (B) % women with disability benefits. (C) % women with unemployment benefits. (D) % women on welfare. *P<0.05; **P<0.01; ***P<0.001.

