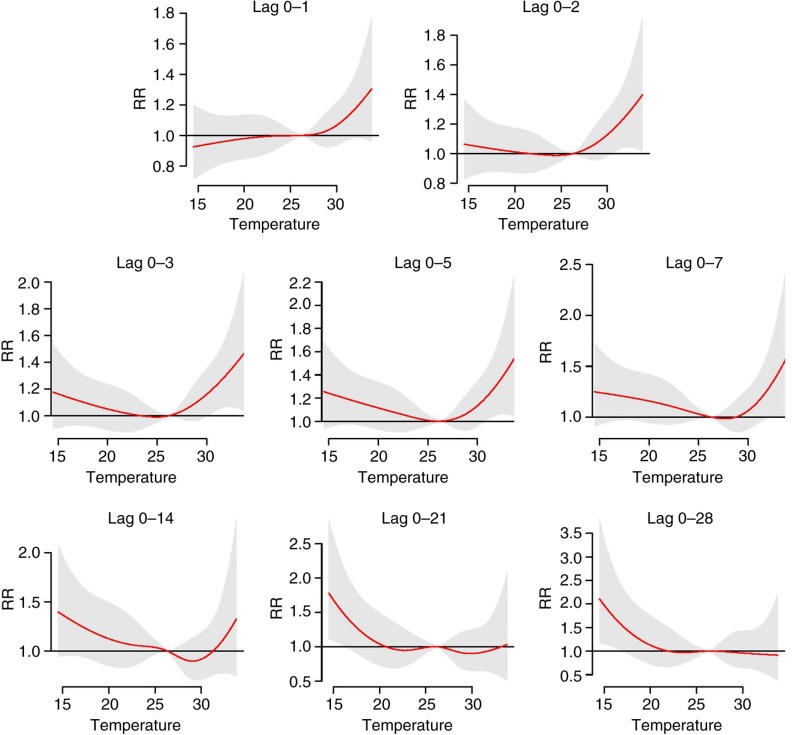
Fig. 2.
Cumulative overall temperature effects on all-cause mortality at different lag periods. The final natural cubic spline–natural cubic spline (NCS–NCS) model defined by distributed lag non-linear model cross-basis functions with 4 degrees of freedom (df) for the temperature dimension and 5 df for the lag dimension. The reference was at the median of temperature. Red lines are the cumulative relative risks, and grey regions are 95% confidence intervals.

