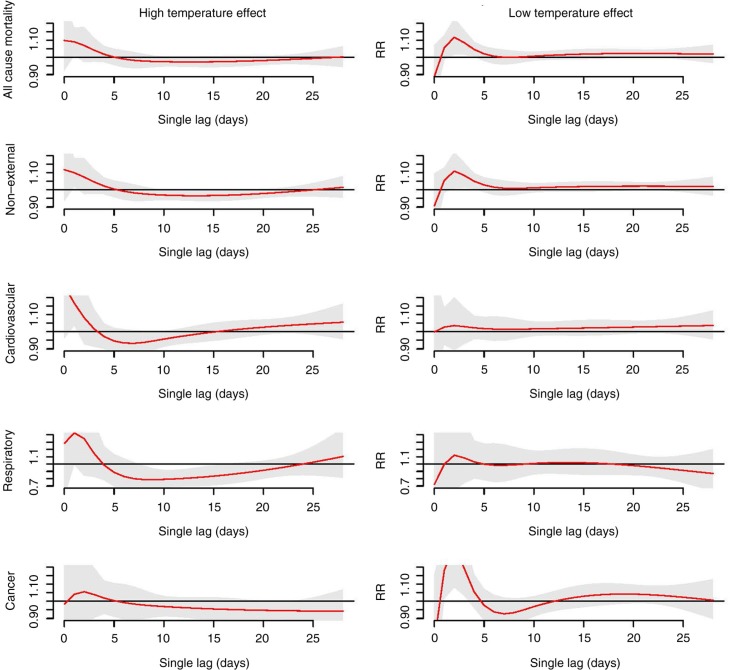
Fig. 5.
The lag structures of high and low temperature effects on all-cause and cause-specific mortality. The high temperature effect (left) is the effect of the 99th temperature percentile (32.4°C) relative to the 50th temperature percentile (26.3°C). The low temperature effect is the effect of the 1st temperature percentile (15.8°C) relative to the 50th temperature percentile (26.3°C). Red lines are the relative risks at single lag, and grey regions are 95% confidence intervals.

