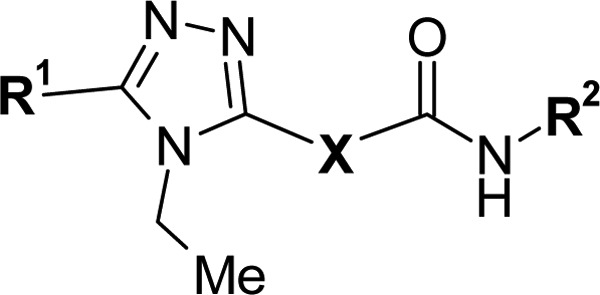
Table 1. Initial SAR Exploration.

| RORγ-LUC EC50a (μM) |
|||||||
|---|---|---|---|---|---|---|---|
| compd | R1 | X | R2 | human | mouse | LEb | Fsp3c |
| 1 | 2-indanyl | SCH2 | 1-naphthyl | 1.7 | 0.70 | 0.25 | 0.24 |
| 2 | OCH2 | >20 | >20 | <0.21 | 0.24 | ||
| 3a | (CH2)2 | 1.0 | 0.40 | 0.26 | 0.27 | ||
| 3bd | CH(Me)CH2 | 1.7 | 1.1 | 0.25 | 0.30 | ||
| 3cd | CH2CH(Me) | 1.3 | 0.67 | 0.25 | 0.30 | ||
| 3dd | CH(OH)CH2 | >20 | >20 | <0.20 | 0.27 | ||
| 3e | c-Hex | (CH2)2 | >20 | 4.5 | <0.23 | 0.43 | |
| 3f | c-HexCH2 | 14 | 2.6 | 0.23 | 0.46 | ||
| 3g | c-Hex(CH2)2 | 0.82 | 0.30 | 0.28 | 0.48 | ||
| 3h | i-Pr(CH2)2 | 13.0 | 1.4 | 0.25 | 0.41 | ||
| 3i | t-Bu(CH2)2 | 6.7 | 0.83 | 0.25 | 0.43 | ||
| 3j | Ph(CH2)2 | 2.5 | 0.63 | 0.25 | 0.24 | ||
| 3k | c-Hex(CH2)2 | 3-Cl-2-Me-Ph | 0.96 | 0.64 | 0.29 | 0.59 | |
| 3l | 2,4-di-Me-Ph | 0.90 | 0.60 | 0.30 | 0.61 | ||
| 3m | 3,5-di-Me-Ph | 2.9 | 3.1 | 0.27 | 0.61 | ||
The EC50s are mean values of at least two replicates.
LE = −1.37 log EC50(LUC hRORγ)/number of heavy atoms.
Fsp3 = number of sp3 hybridized carbons/total carbon count.
Racemic.
