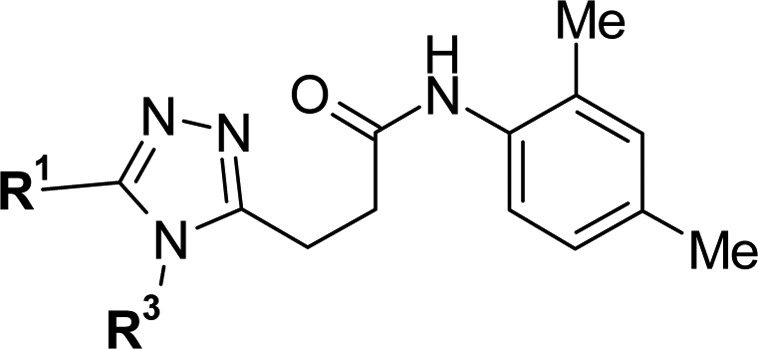
Table 2. SAR of R1 Portion and R3 Portion.

| RORγ-LUC EC50a (μM) |
MS in liver S9 (remaining
%) |
|||||||
|---|---|---|---|---|---|---|---|---|
| compd | R1 | R3 | human | mouse | LE | Fsp3 | 10 min | 60 min |
| 3l | c-Hex(CH2)2 | Et | 0.90 | 0.60 | 0.30 | 0.61 | 36 | 0 |
| 3n | c-Pr | 0.98 | 0.45 | 0.28 | 0.63 | 55 | 23 | |
| 3o | c-Bu | 9.5 | 1.8 | 0.23 | 0.64 | 49 | 27 | |
| 3p | 2,2-di-F-c-Pr | 0.92 | 0.50 | 0.27 | 0.63 | 75 | 59 | |
| 3qb | 2-Bu(CH2)2 | c-Pr | 3.9 | 1.4 | 0.27 | 0.59 | 63 | 27 |
| 3r | i-Pr(CH2)3 | 1.7 | 0.61 | 0.29 | 0.59 | 67 | 27 | |
| 3s | t-Bu(CH2)3 | 2.8 | 1.3 | 0.27 | 0.61 | 71 | 51 | |
The EC50s are mean values of at least two replicates.
Racemic.
