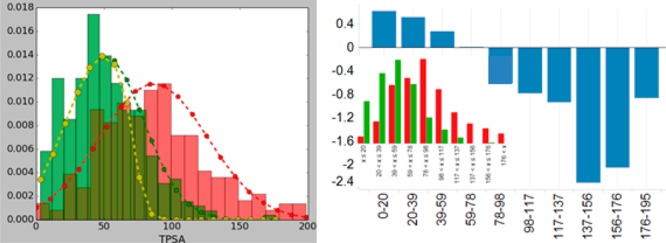
Figure 1.

TPSA distribution for desired and undesired molecules is shown in green and red, respectively. The yellow curve corresponds to a desirability function that can be used to separate desired molecules from undesired ones. Scores obtained from a Bayesian model for the TPSA values are given on the right-hand-side. Inset in the right-hand side corresponds to the TPSA distribution for the corresponding bins.
