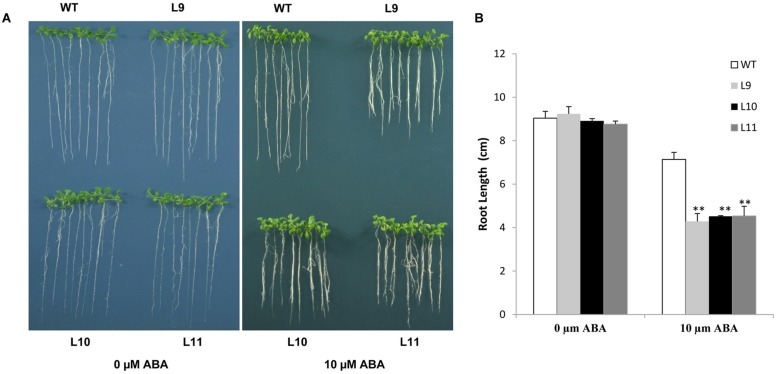
FIGURE 8.
Responses of TaNAC47-overexpressing transgenic plants to ABA. (A) Phenotype of the transgenic and WT plants on MS with 0 and 10 μM ABA. (B) Root lengths of plants on MS with 10 μM ABA. The data represent the means from three experiments. The bars show the SD. Significant differences between the transgenic and WT lines are indicated as ∗0.01 < P < 0.05 and ∗∗P < 0.01.

