
Figure 2. Characteristics and Distribution of γδT17 Cells in Human CRC.
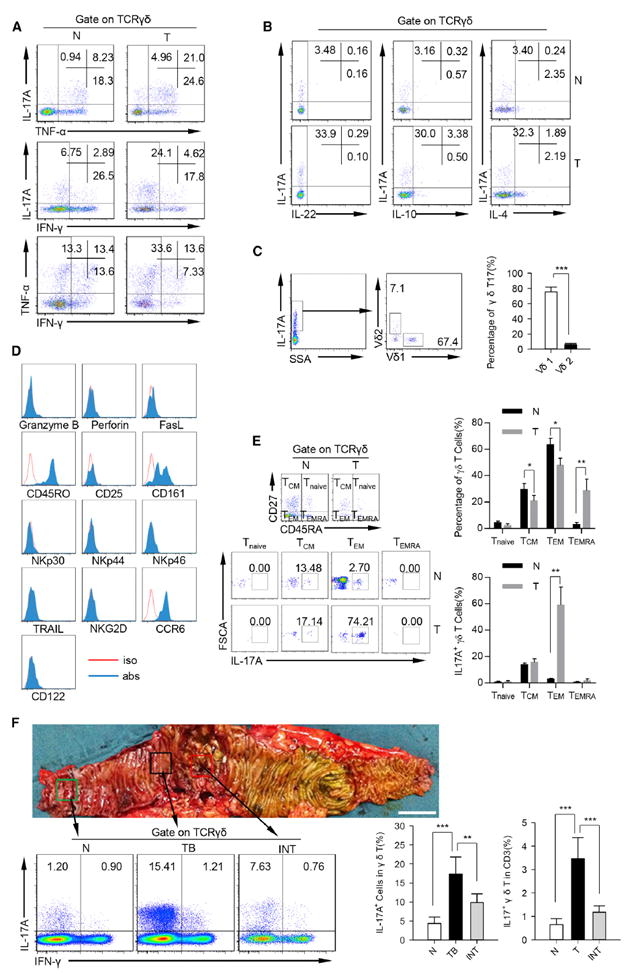
(A) Representative flow cytometric analysis of intracellular IL-17, IFN-γ, and TNF-α production by γδT cells in tumor and paired normal tissues. Plots were gated on γδTCR+ cells. One of ten independent experiments is shown. N, normal tissue; T, tumor.
(B) Representative flow cytometric analysis of IL-22, IL-10 and IL-4 production by γδT cells in tumor and paired normal tissues. Plots were gated on CD45+ CD3+ γδTCR+ cells. One of ten independent experiments is shown. N, normal tissue; T, tumor.
(C) Single cell suspensions from tumor tissues were stained with a panel of antibodies (anti-human CD45, anti-human CD3, anti-human TCRVd1, anti-human TCRVd2, and anti-human IL-17A) and analyzed by FCM. Left panel shows representative flow cytometric analysis of TCRVδ1+ cells and TCRVδ2+ cells in tumor-infiltrating γδT17 cells. Plots were gated on TCRγδ+ IL-17A+ cells. One of ten independent experiments is shown. Right panel bar diagram shows percentages of TCRVδ1+ cells and TCRVδ2+ in tumor-infiltrating γδT17 cells. Data are shown as mean ± SEM; n = 10; ***p < 0.001.
(D) Phenotype of tumor-infiltrating γδT17 cells in CRC patients were detected by FCM. Flow plots were gated on CD45+ CD3+ TCRγδ+ IL-17A+ cells. One of six independent experiments is shown.
(E) Left panel representative flow cytometric analysis of differentiation-related markers of γδT17 cells in the tumor and paired normal tissues. Up right panel shows summarized data that show the percentages of Tnaive, Tcm, Tem, and Temra in γδ T cells. Bottom right panel shows summarized data that show the percentages of IL-17A+ cells in Tnaive, Tcm, Tem, and Temra γδ T cells. Plots were gated on CD45+ CD3+ TCRγδ+ cells. One of six independent experiments is shown. N, normal tissue; T, tumor.
(F) Bottom left shows that γδT17 cells were detected by FCM. Plots were gated on CD45+ CD3+ TCRγδ+ cells. One of ten independent experiments is shown. Bottom right bar diagram shows percentages of IL-17A+ cells in γδT cells and IL-17A+ γδT cells in CD3+ cells in normal, tumor border, and intratumor tissues. N, normal tissue; TB, tumor border; INT, intratumor. Data are shown as mean ± SEM; n = 10; **p < 0.01; ***p < 0.001.
See also Figure S2.