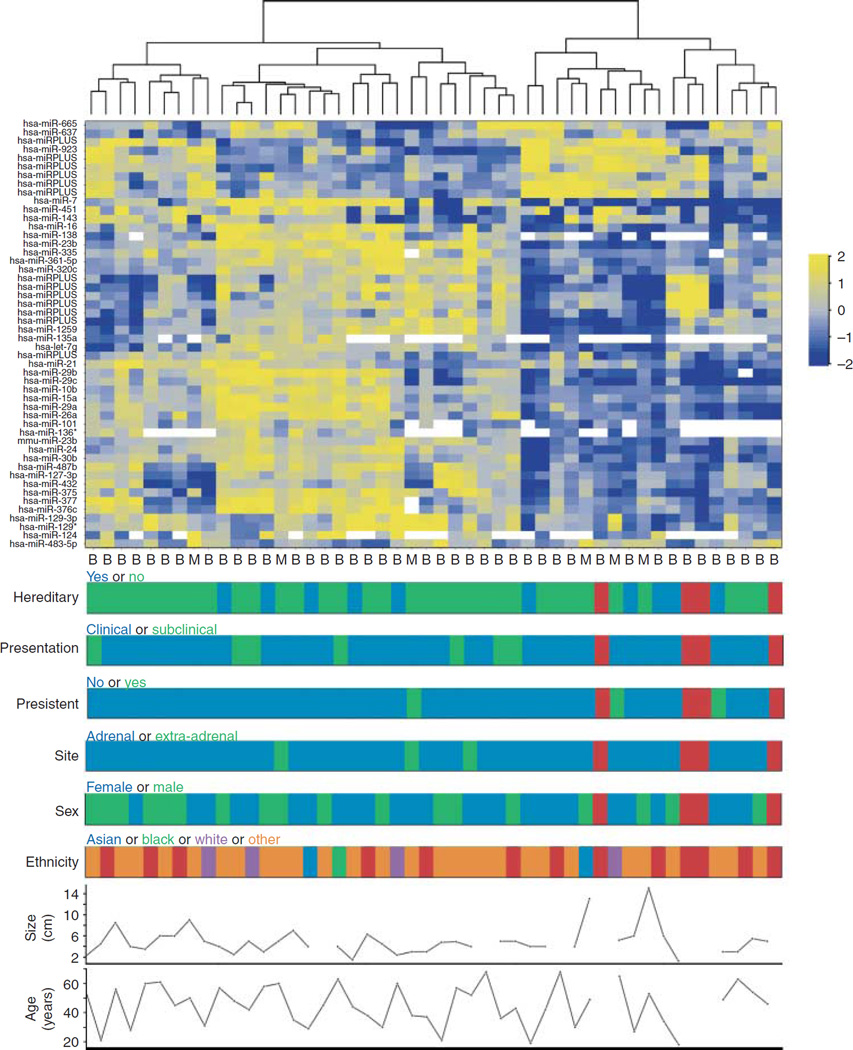
Figure 2.
Heatmap of the 50 most variably expressed miRNAs. Unsupervised hierarchical clustering was performed using Euclidian distance as the similarity metric. Expression variability was defined by greatest median absolute deviation across all samples. Each row represents an miRNA and each column an individual tumor sample. ‘miR-Plus’ miRNAs are proprietary to Exiqon. Tumor type is indicated below the heatmap as either benign (B) or malignant (M). Demographic and clinical data are plotted below the heatmap (red indicates data not available).

