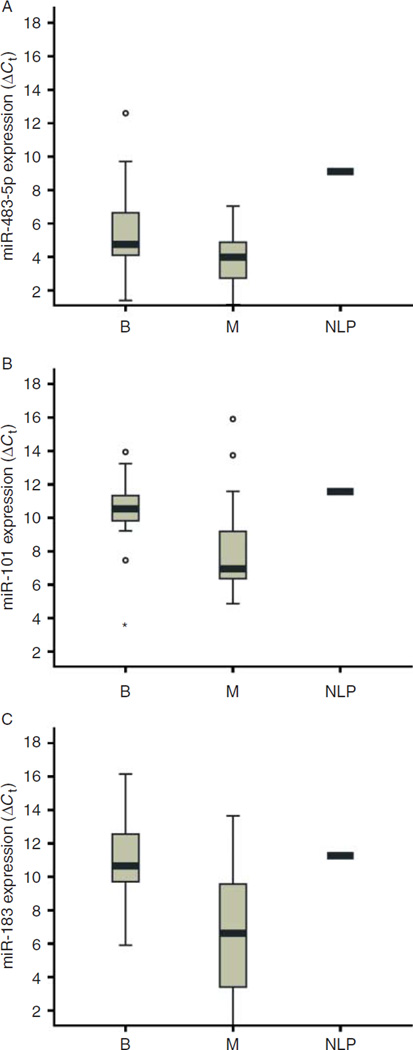
Figure 3.
miRNA expression in benign and malignant tumors and normal adrenal medulla tissue (pool of 21 samples). The box plots represent (A) miRNA-483-5p, (B) miR-101, and (C) miR-183 expression as defined as the ΔCt, as described in the Materials and Methods. A lower ΔCt indicates higher miRNA expression level. In these graphs, potential outliers are indicated by either open circles (outlier) or asterisks (extreme outlier). B, benign; M, malignant; NLP, normal.

