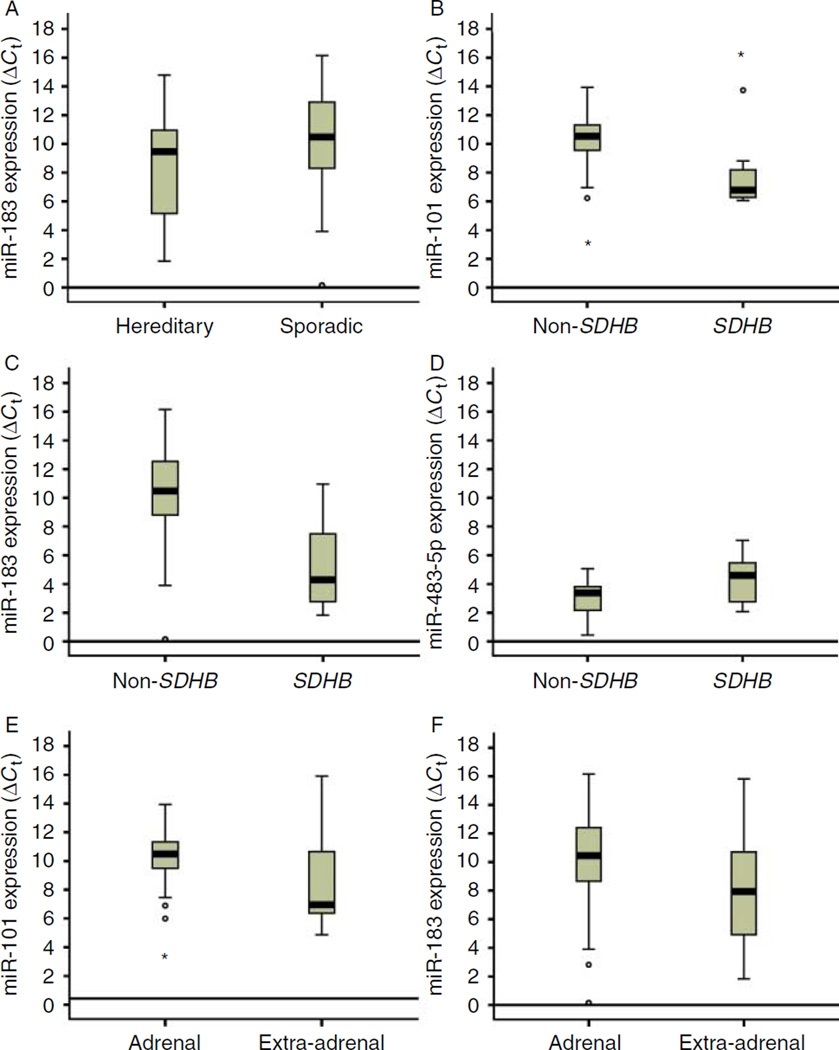
Figure 4.
miRNA expression differences in samples categorized by various clinical factors. Expression is defined as the ΔCt, as described in the Materials and Methods. A lower ΔCt indicates higher miRNA expression level. miRNA expression differences were found in the comparison of (A) hereditary vs sporadic, (B, C and D) SDHB vs non-SDHB, (E and F) and adrenal vs extra-adrenal tumors. In these plots, potential outliers are indicated by either open circles (outlier) or asterisks (extreme outlier).

