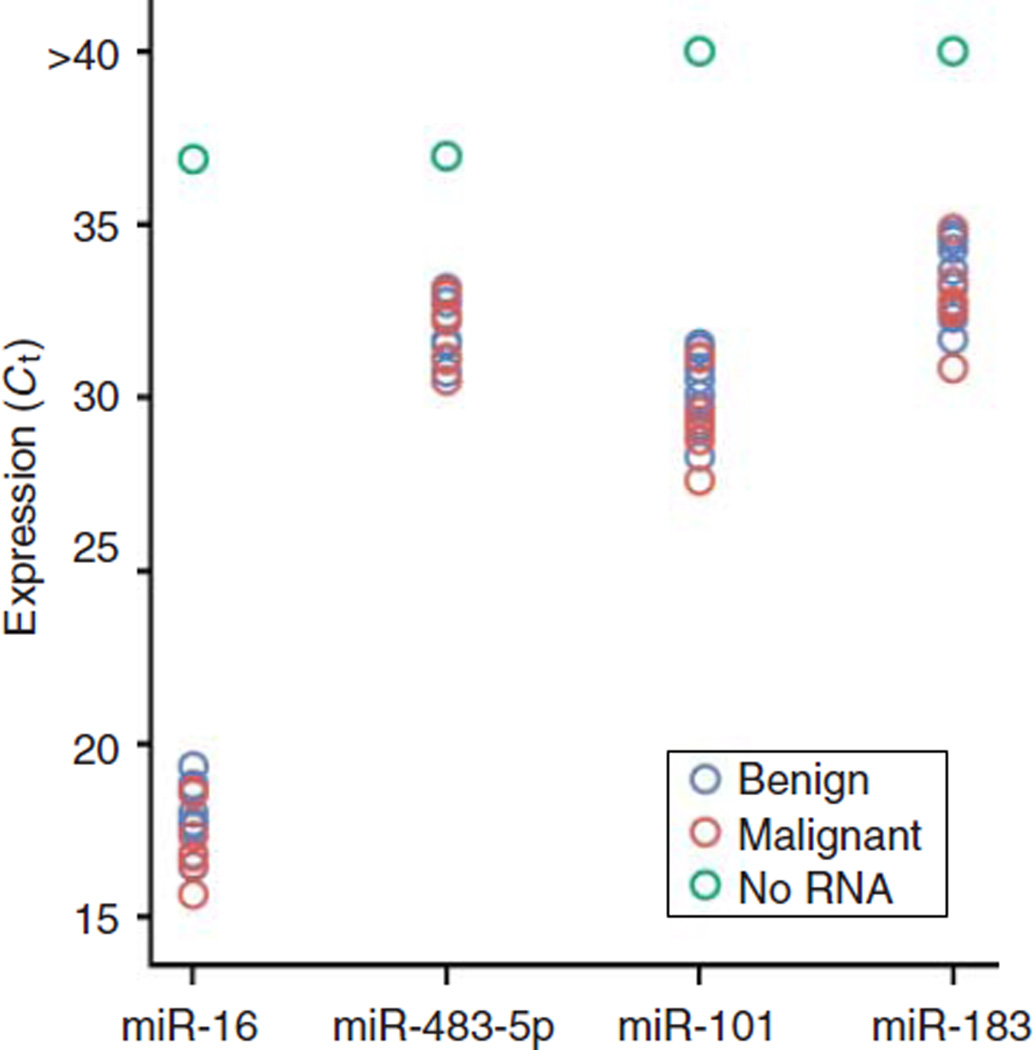
Figure 6.
Expression level of miRNAs in patient serum. The scatter plot shows the miRNA expression as the Ct measured by qRT-PCR for each sample. Serum samples from patients with benign tumors (blue), patients with malignant tumors (red), or the no RNA template control (green) were included in this analysis. A lower Ct indicates higher miRNA expression level.

