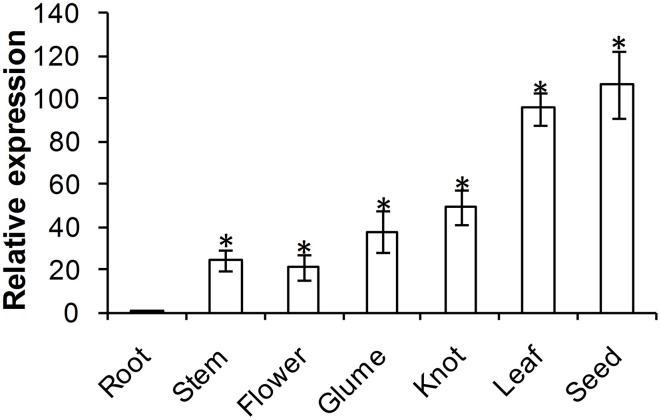
Figure 3.
Expression patterns of TaADF3 in different wheat tissues. Samples were collected from root, stem, flower, glume, knot, leaf, and seed. The relative expression level was analyzed by qRT-PCR and normalized to the wheat elongation factor TaEF-1α gene. Three independent biological replications were performed. Asterisks indicate a significant difference (P < 0.05) from the root using Student's t-test.

