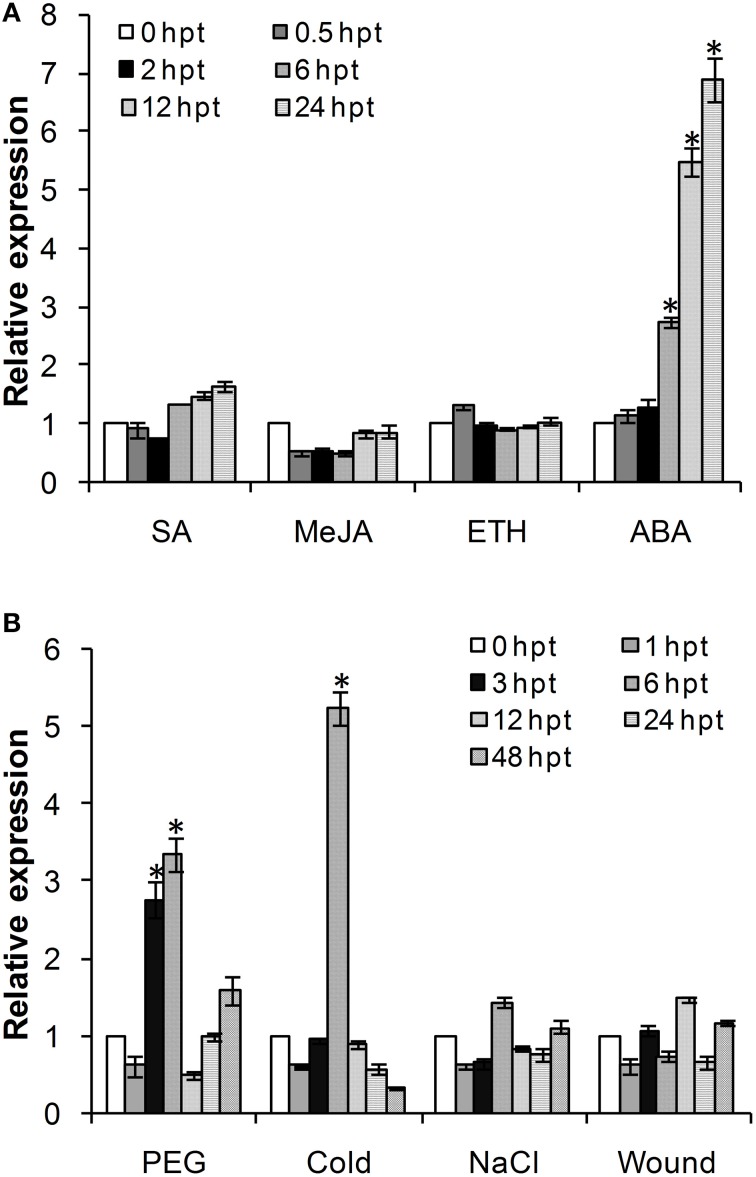
Figure 4.
Expression profile of TaADF3 in response to exogenous hormones (A) and abiotic stresses (B). Three independent biological replications were performed. The expression levels were normalized to TaEF-1α, and the results are shown as the mean ± standard deviation of three biological replications. Asterisks indicate a significant difference (P < 0.05) from 0 hpt using Student's t-test. SA, salicylic acid; MeJA, methyl jasmonate; ETH, ethylene; ABA, abscisic acid.

