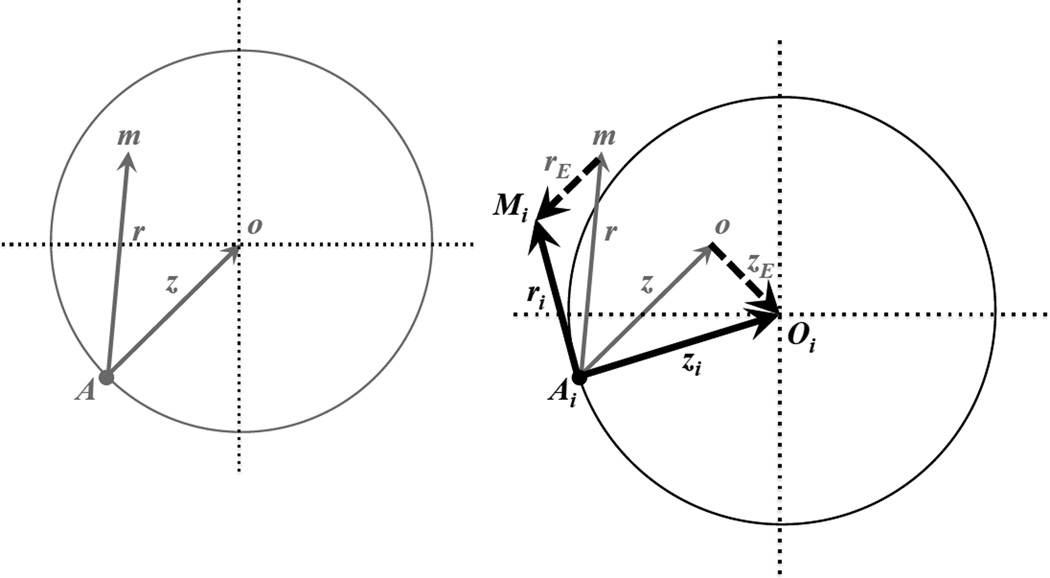
Figure 1.
Fisher’s geometric model with and without O×E and G×E effects: an example in two dimensions. The left panel shows the classic model, which excludes O×E and G×E effects. The wild-type genotype expresses phenotype at position A; a mutant homozygote expresses at position m; the optimal phenotype is at position o. Gray vectors (arrows, of length z and r) describe the displacements of the optimum (z) and the mutant homozygote (r) away from the wild-type phenotype. Mutant displacements that land within the gray circle (as shown in the example mutation) improve fitness; those landing outside of the circle reduce fitness. O×E and G×E effects (shown in the right panel) randomly shift the phenotypic values of the trait optimum and the mutant phenotype. Example O×E and G×E shifts are depicted by the dashed vectors, with respective magnitudes of zE and rE. The environment-specific locations of the optimum and mutant genotype (i.e., for the ith environment, as shown) are represented by points Oi and Mi. In the ith environment, the total displacements away from the wild-type phenotype are now represented by the bold, black vector that points toward Oi (with magnitude zi). All extant genotypes will experience this same shift in the optimum. A new mutation would have had phenotype m, but now in the new environment its displacement from the initial wild-type phenotype is Mi (with magnitude ri). Mutant displacements that land within the black circle are beneficial; those that land outside (as shown) are deleterious. Additional discussion is provided in the main text.

