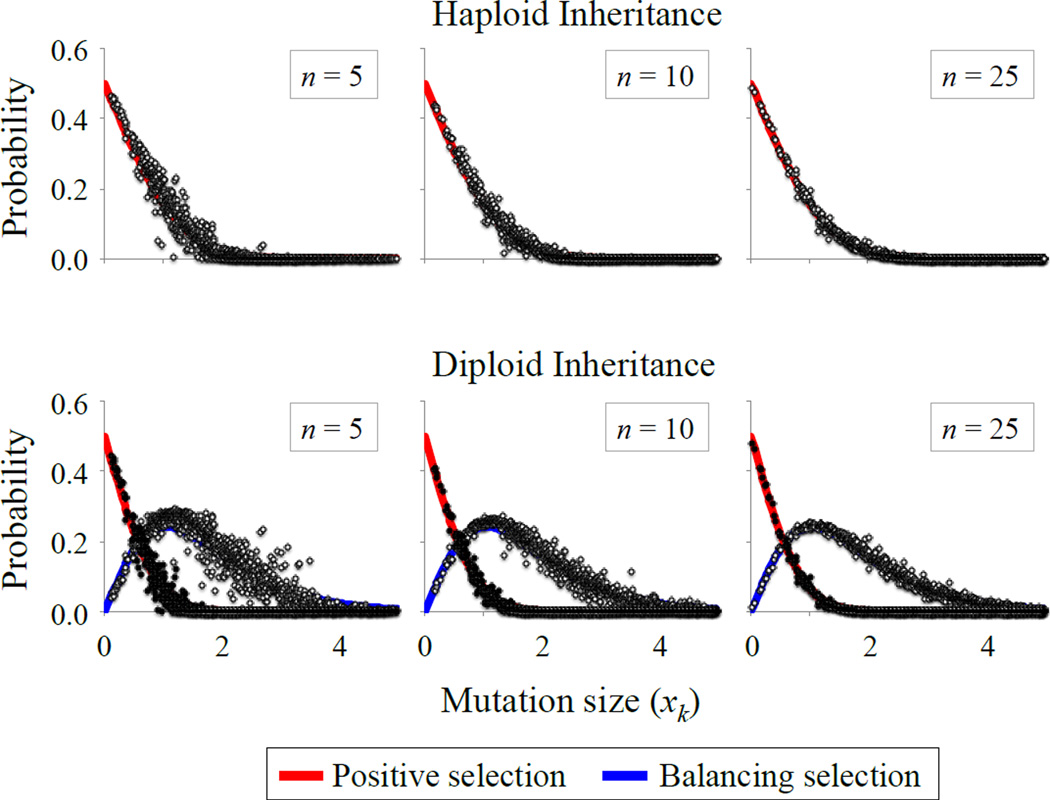
Figure 2.
Environmental heterogeneity and adaptive mutations. The top row shows the probability that a mutation is positively selected in haploids, with the solid curves representing the analytical approximation. For each simulated datapoint (circles), we generated random values of z, r, rE and zE (each is independently sampled from a uniform distribution between 0 and 0.5), and calculated the fraction of 10,000 random mutations that met the condition for positive selection. The bottom row shows the probabilities of positive and balancing selection in diploids. Solid curves provide the analytical approximations. Simulations were conducted as in haploids, but with selection criteria relevant to diploids, and with codominant phenotypic effects of each mutation (see Model section). Additional parameters are: k = 10, ω = 0.5 (also see Fig. S2, which shows results for k = 2). Simulated data show results for the spatial heterogeneity model; qualitatively similar results arise under temporal heterogeneity.

