. 2015 Nov-Dec;23(6):580–590. doi: 10.1590/1678-775720150285

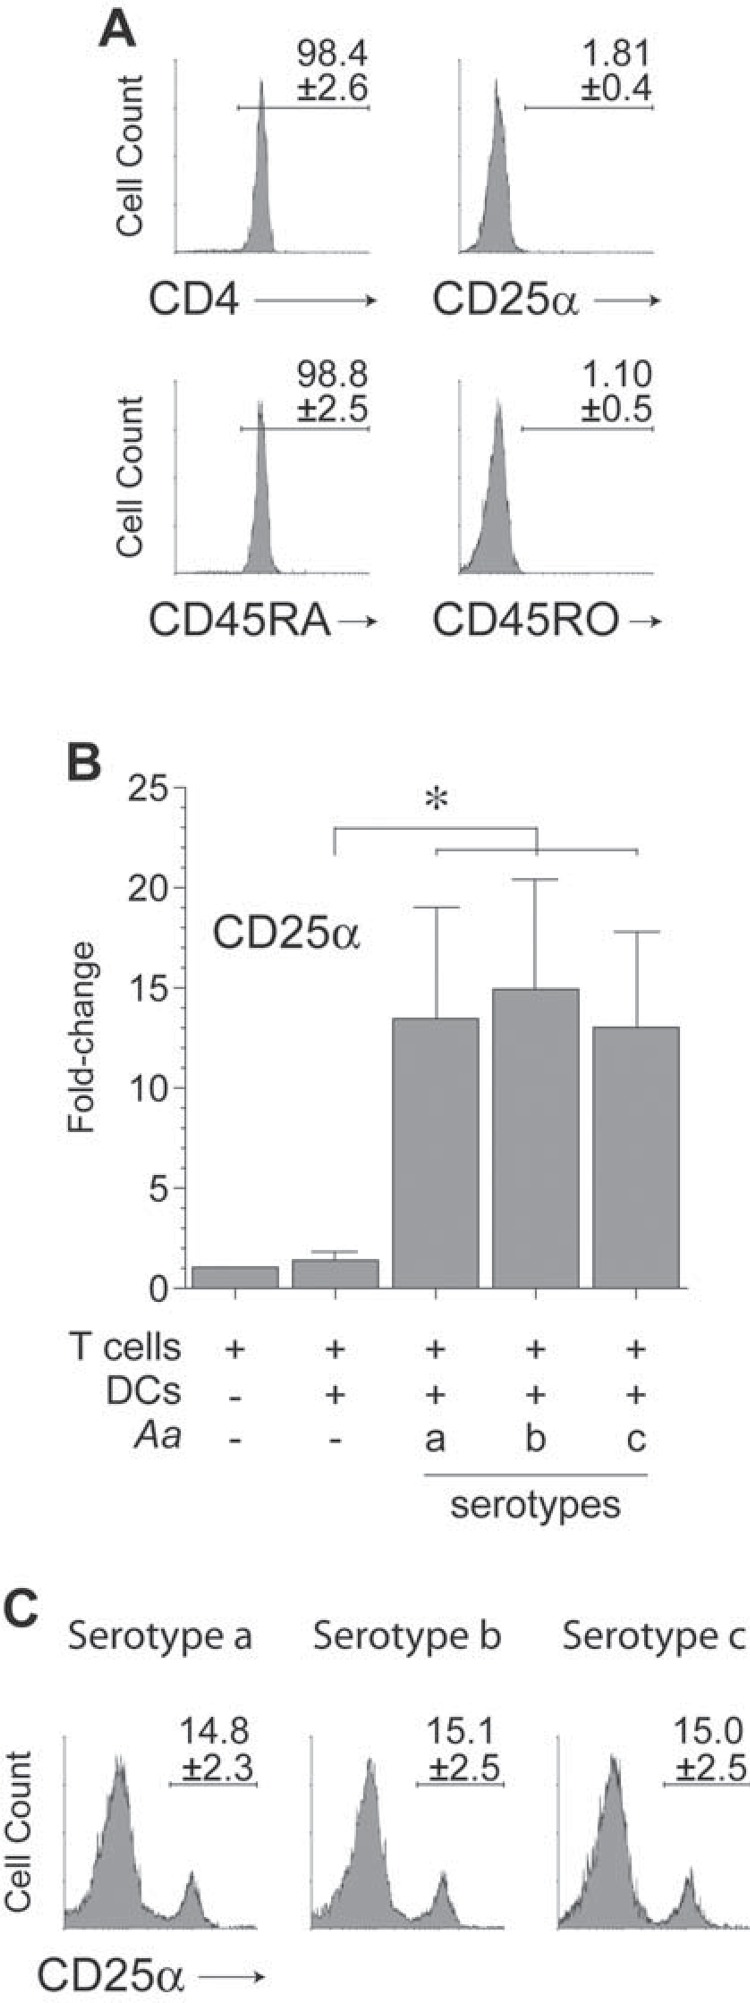
Figure 2. T-lymphocyte purification and activation. A: T-lymphocyte purification. Flow cytometry analysis of CD4, CD25α, CD45RA, and CD45RO expression demonstrating the purity of naïve CD4+ T lymphocytes isolated from healthy donors. B: T-lymphocyte activation. The qPCR analysis for the CD25α mRNA expression in CD4+ T lymphocytes stimulated by autologous dendritic cells primed at a MOI=102 with the A. actinomycetemcomitans strains ATCC® 43717™ (serotype a), ATCC® 43718™ (serotype b), and ATCC® 43719™ (serotype c). C: T-lymphocyte activation. Flow cytometry analysis of the CD25α expression demonstrating the levels of activation of CD4+ T lymphocytes after 5-day stimulation under the same conditions described in Figure 2B. The flow cytometry data from each experiment were expressed as percentage of positive cells over the total, and shown as mean±SD from 4 independent experiments. For relative expression, the CD25α mRNA expression in T lymphocytes cultured in the absence of dendritic cells was considered as 1, as a reference for fold-change in expression. Data are represented as fold-change for 8 independent experiments. Each experiment was performed in duplicate. Comparisons were done versus T lymphocytes exposed to non-induced dendritic cells (*p<0.05). Aa, Aggregatibacter actinomycetemcomitans; CD, cluster of differentiation; DCs, dendritic cells.

Figure 2