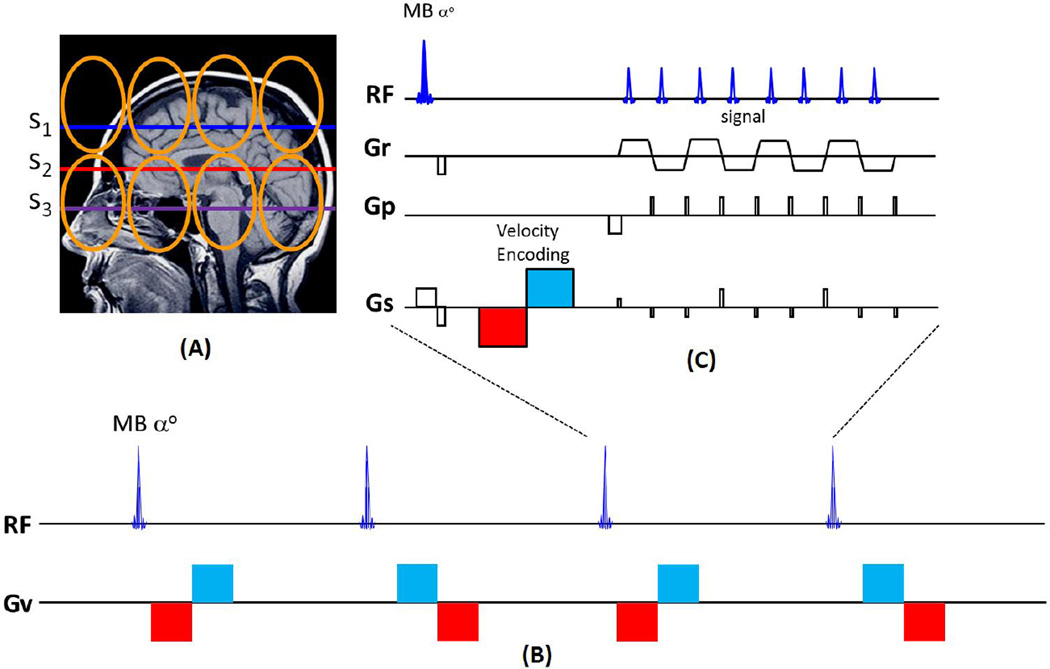
Figure 1.
Diagram of simultaneous multi-slice (SMS)-EPI velocity pulse sequence. (A) Three simultaneous excitation planes (S1-S3). Coil array coverage (orange loops) is shown. (B) The pulse sequence acquisition scheme illustration for multiband velocity imaging. The polarity of the velocity phase encoding +/− is determined by the polarity of the bipolar pulse (red/blue vs. blue/red) used in each TR of the encoding scheme. Sequential pairs of time frames encoded with alternating phase polarity are subtracted to create each velocity image. The time series of velocity images can generate the velocity movie. (C) The SMS-EPI velocity pulse sequence diagram. The multiband (MB) excitation pulse is followed by the (velocity encoding) bipolar gradient (red/blue) pulse and the SMS-EPI readout. Radiofrequency (RF), read gradient (Gr), phase encoding gradient (Gp), slice selective gradient (Gs).

