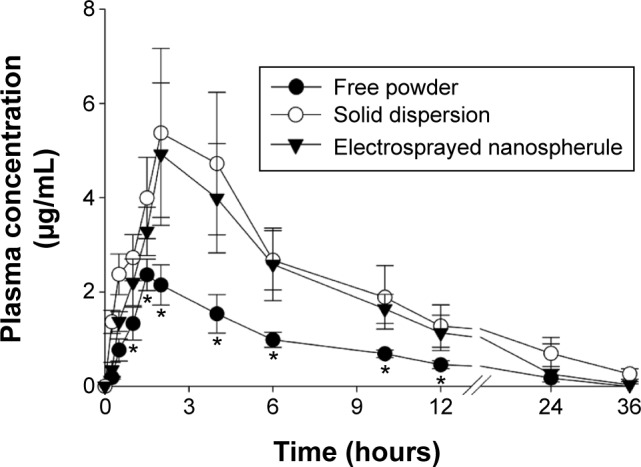
Figure 6.

Mean plasma level vs time profiles of fenofibric acid in rats after oral administration of free powder, solid dispersion, and electrosprayed nanospherules.
Notes: Each dose was equivalent to 20 mg/kg fenofibrate. The electrosprayed nanospherules and the solid dispersion were composed of fenofibrate, PVP, and Labrafil M 2125 at the weight ratio of 1:4:0.5. Each value represents the mean ± SD (n=6). *P<0.05 compared with the free drug.
Abbreviations: PVP, polyvinylpyrrolidone; SD, standard deviation.
