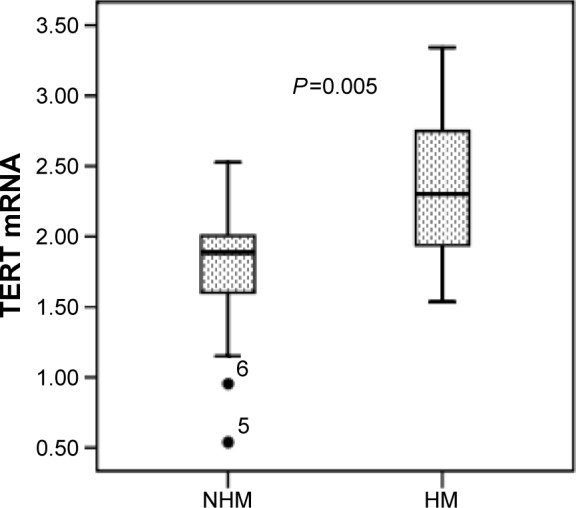
Figure 4.

Median mRNA levels of TERT between HM and NHM GC tissues.
Note: 5 and 6 are identifiers of two samples in the statistical analysis.
Abbreviations: GC, gastric cancer; HM, hypermethylation; NHM, non-hypermethylation; TERT, telomerase reverse transcriptase.
