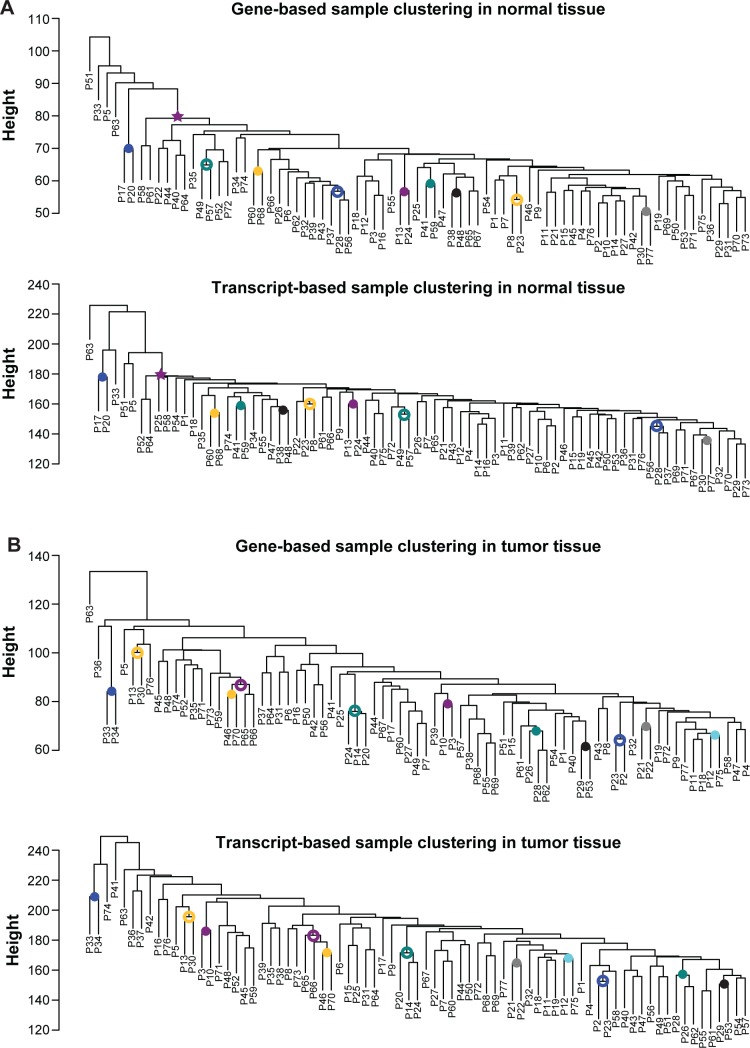
Figure 1.
Patient clustering based on gene/transcript expression profiles.
Notes: The clustering of normal (A) and tumor (B) tissue samples according to the expression profiles of genes (the upper panel in [A] and [B]) and transcript isoforms (the lower panel in (A) and (B)). The filled circles, open circles, and the star indicate splits shared between the gene-based and the transcript-based trees.

