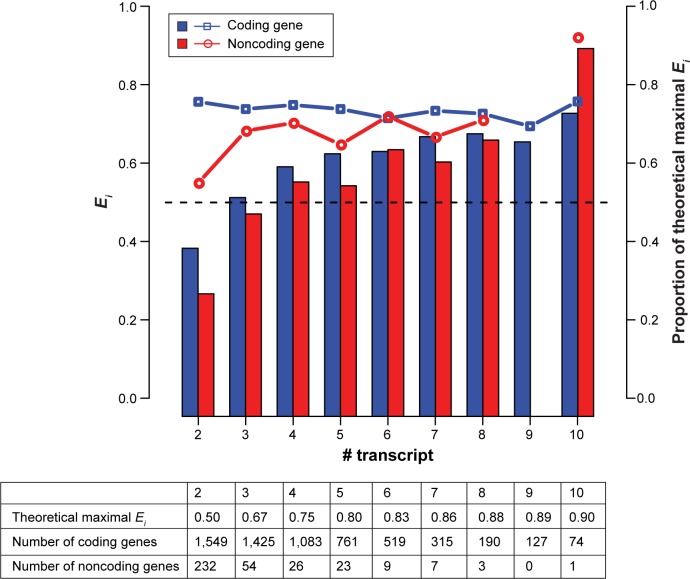
Figure 2.
Transcript module entropy (Ei, bars and the left axis) and the proportion of Ei relative to the theoretical maximal value (lines and the right axis) for coding (blue) and noncoding genes (red).
Notes: The X-axis indicates the number of transcript isoforms per gene. The dashed line indicates Ei=0.5. Note that the grey module is excluded for the calculation of Ei in this figure. Also, note that the red bar is missing and the red line is broken at X=9 because none of the analyzed noncoding genes includes nine transcript isoforms.

