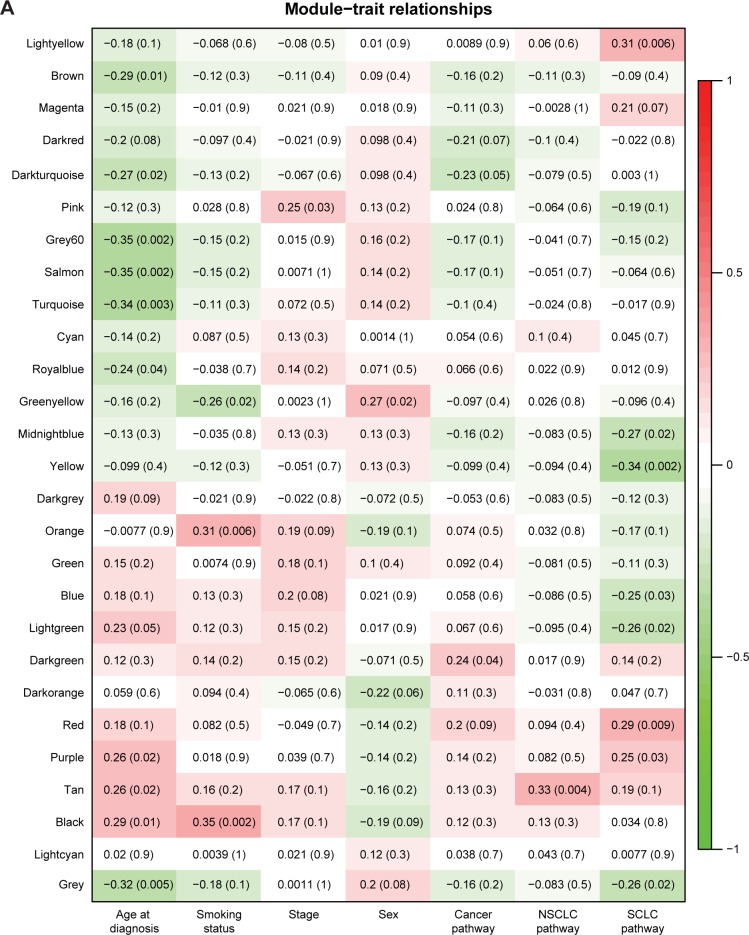
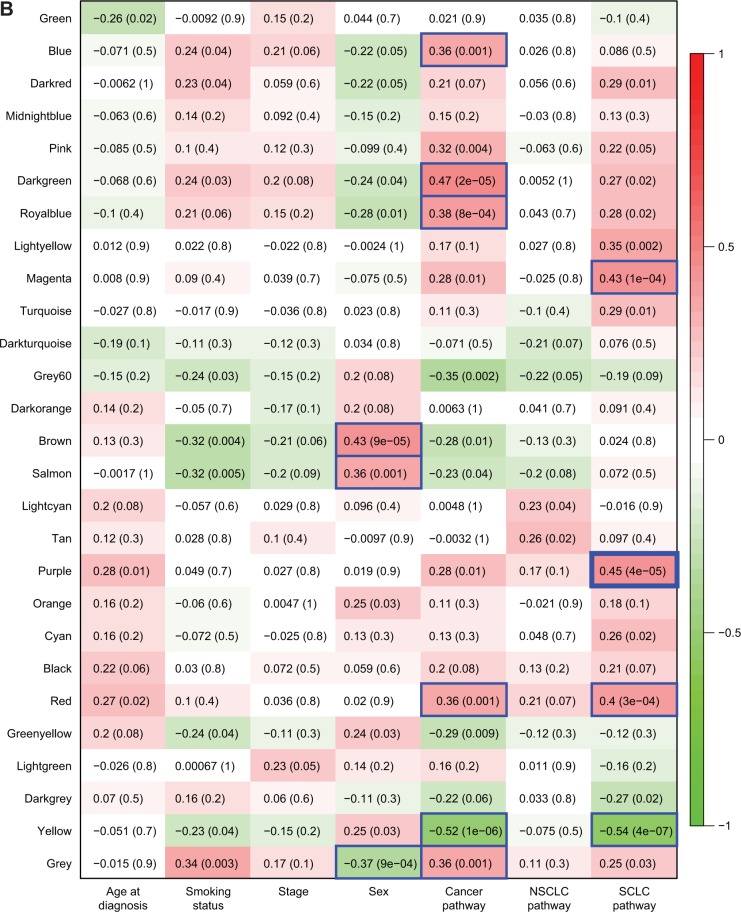
Figure 3.
The correlations between network modules and patient features/cancer pathways.
Notes: The correlations between patient features/cancer-related pathways and the eigengenes of GN modules for (A) normal tissues and (B) tumor tissues. The red and green colors indicate positive and negative correlation, respectively. The non-parenthesized number in a cell indicates the Pearson’s coefficient of correlation, followed by the P-value in the parenthesis. The blue color-framed cells indicate statistically significant correlations. Note that the cutoff P-value for statistical significance was Bonferroni-corrected to 0.002.
Abbreviations: GN, gene-based network; NSCLC, non-small-cell lung cancer; SCLC, small-cell lung cancer.


