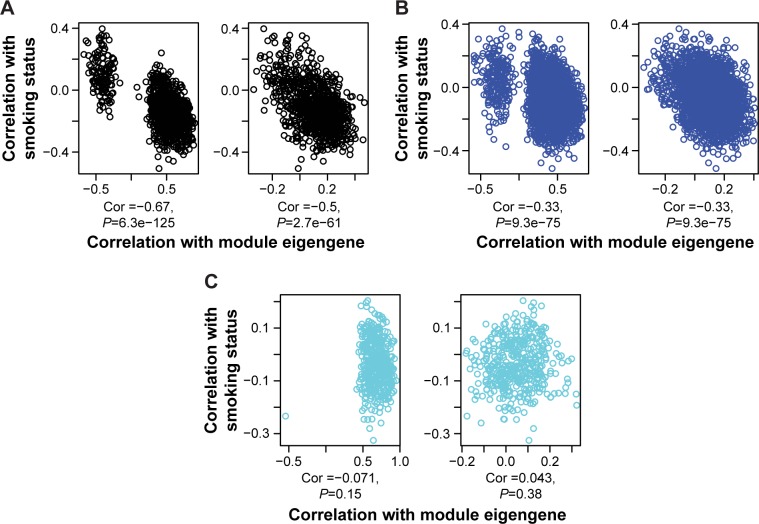
Figure 4.
The correlations (Cor) between module member transcript isoforms and the eigentranscript (X-axis) against the correlations between the same isoforms and smoking status (Y-axis) for tumor (left column) and normal tissue (right column).
Note: Three different modules ([A]: number 16, [B]: number 24, and [C]: number 14) are shown in this figure.

