. 2015 Nov 9;4:e10111. doi: 10.7554/eLife.10111

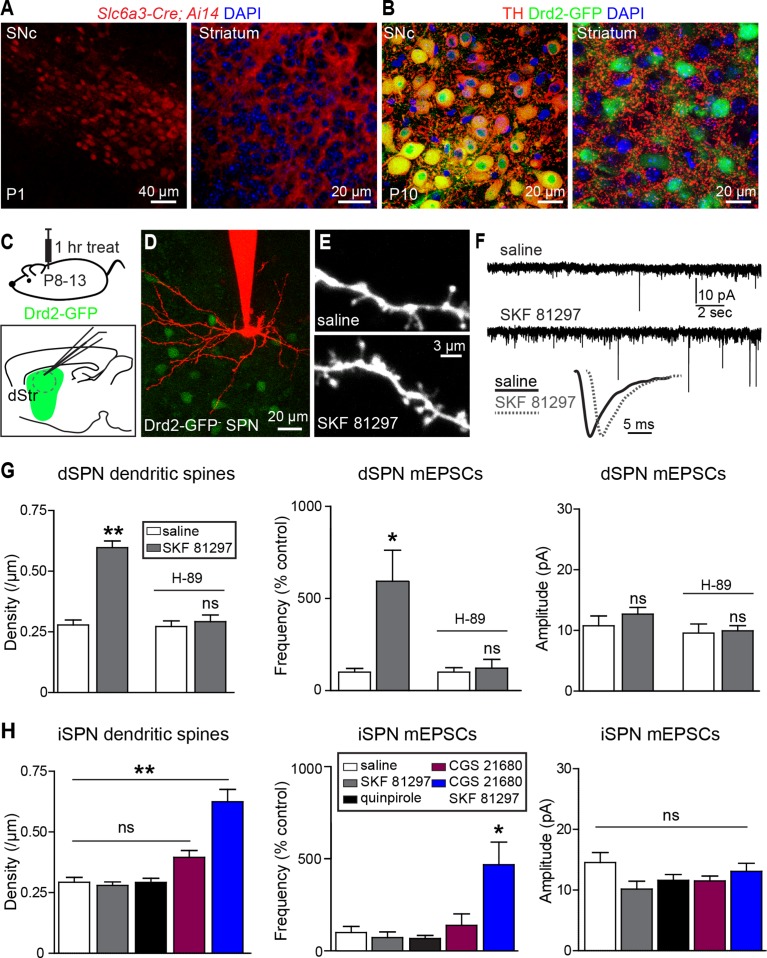
Figure 1. Gαs GPCR stimulation rapidly increases SPN dendritic spine and excitatory synapse number.

(A) Cre recombinase expression driven by dopamine transporter gene (Slc6a3) promoter activates tdTomato expression (red) in a reporter mouse, revealing cells bodies in SNc (left) and densely innervating fibers within striatum (right) at postnatal day 1 (P1). (B) At P10, immunohistochemistry for tyrosine hydroxylase shows expression in SNc cell bodies (left) and a punctate pattern in the striatum (right). (C) Schematic of the experiment and recording preparation. (D) 2PLSM image of a Drd2-GFP negative SPN filled with Alexa 594 during whole-cell recording. (E) 2PLSM images of dendrites and dendritic spines on dSPNs after saline or SKF 81297 administration in vivo. (F) Example mEPSC recordings and individual events demonstrating enhanced mEPSC frequency in dSPNs with Drd1 stimulation. (G) Summaries of spine density, mEPSC frequency and amplitude in dSPNs following in vivo administration of saline or the Drd1 agonist SKF 81297 to control animals or those treated with the PKA antagonist H-89. (H) Summaries of spine density, mEPSC frequency and amplitude in iSPNs following in vivo administration of saline, the Drd1 agonist SKF 81297, the Drd2 agonist quinpirole, the A2aR agonist CGS 21680, or SKF 81297 and CGS 21680 together.

DOI: http://dx.doi.org/10.7554/eLife.10111.003

Figure 1.

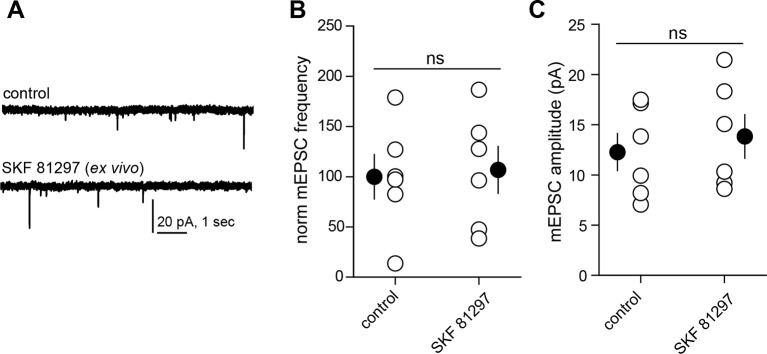
Figure 1—figure supplement 1. Drd1 agonist treatment of the acute brain slice fails to enhance excitatory synapse numbers on dSPNs.

Figure 1—figure supplement 1.

(A) Trace examples of miniature EPSC (mEPSC) recordings from dSPNs in slices that were incubated in the presence or absence of Drd1 agonist SKF 81297 (10 µM) for ~1 hr. (B) Summary data demonstrating no difference in normalized mEPSC frequency between conditions. Error bars indicate SEM. C. Summary data demonstrating no difference in mEPSC amplitude between conditions. Error bars indicate SEM.

Figure 1—figure supplement 2. Acute Drd1 agonist treatment induces locomotion in immature pups.
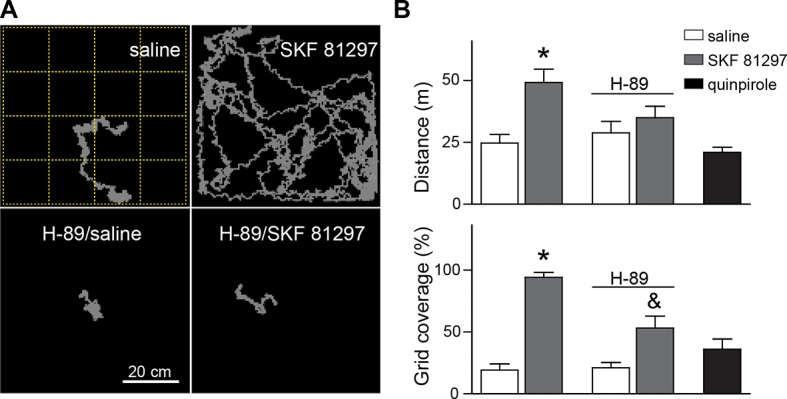
Figure 1—figure supplement 2.

(A) View from above the arena used to record locomotor activity and quantify grid crossings, with example tracks of individual mice from the noted conditions recorded for 30 min. (B) Summary graphs of distance travelled and grid coverage from mice injected with saline, Drd1 agonist SKF 81297, or Drd2 agonist quinpirole. A subset of animals was pre-treated with PKA blocker H-89 thirty minutes before saline/agonist injections. Drd1 agonist treatment increased locomotion, an effect that was partially blocked by H-89 pre-administration. N=9, 11, 7 and 5 mice/group; *p<0.05, p<0.1; error bars indicate SEM.

Figure 1—figure supplement 3. Drd1 agonist treatment repeatedly potentiates locomotion in immature pups.
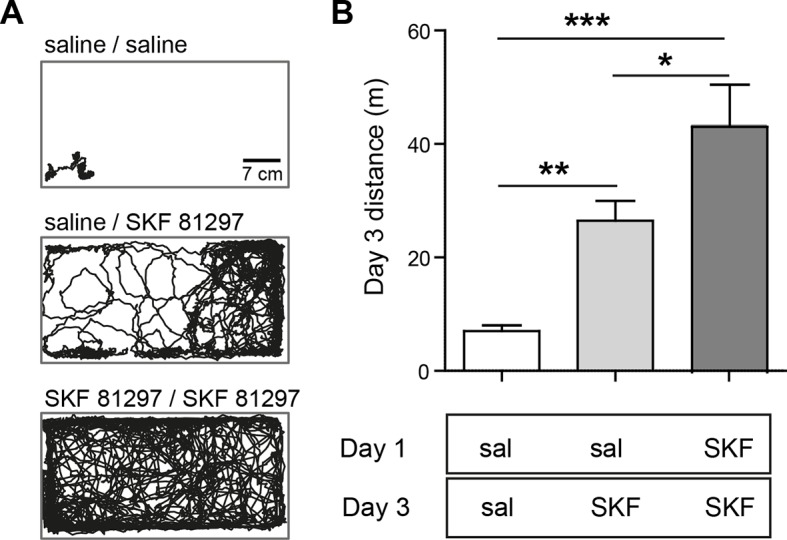
Figure 1—figure supplement 3.

(A) View from above the arena used to record locomotor activity, with example tracks of individual mice from the noted conditions recorded for 30 min, on day 3 of the experiment. P9 mice received priming injections on day 1, as noted, and their locomotor behavior in response to a second injection on Day 3 was evaluated. (B) Summary graph of distance travelled from mice injected twice with saline on days 1 and 3, saline and SKF 81297, or two rounds of SKF 81297 treatment. Drd1 agonist treatment increased locomotion and further potentiated SKF 81297-induced locomotion increase on day 3. N=10 mice/group; one-way ANOVA p<0.0001, post hoc tests *p<0.05, **p<0.01, *** p<0.001; error bars indicate SEM.