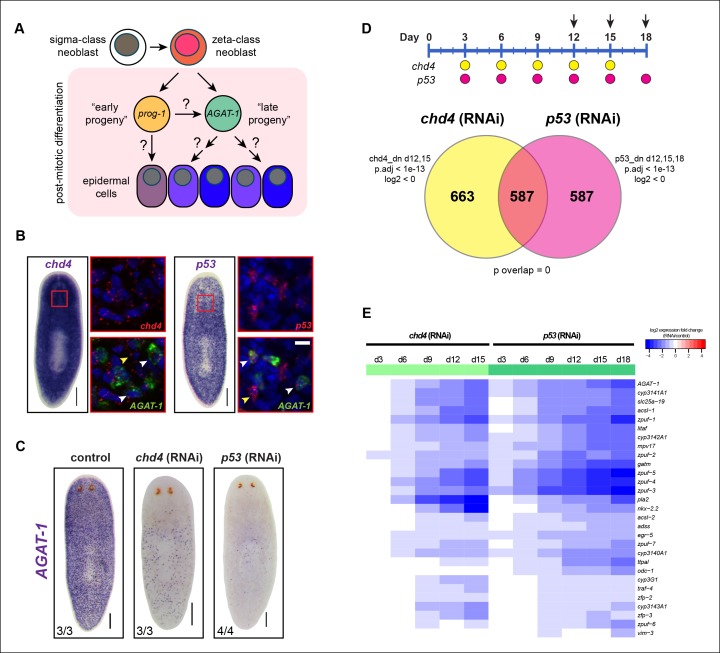
Figure 1. Identification of a common transcriptional down-regulated gene set in chd4 and p53 RNAi animals.
(A) Current model of planarian epidermal lineage specification. Sigma-class neoblasts give rise to zeta-class neoblasts, which in turn generate prog-1 (early progeny) and AGAT-1 (late progeny) expressing cells. The precise molecular relationship between these cell types remains unclear, but collectively give rise to an unknown number of epidermal cell types through an unknown number of transitional states. (B) Whole-mount in situ (WISH) expression patterns of chd4 and p53 in wild-type planaria. Left panels: chd4 colorimetric WISH and double fluorescent in situ (FISH) of chd4 (red), AGAT-1 (green) and DAPI (blue). Right panels: p53 colorimetric WISH and double FISH of p53 (red), AGAT-1 (green) and DAPI (blue). Magnified regions are single confocal planes from boxed regions. White arrowheads highlight cells with co-localized expression of either chd4 or p53 and AGAT-1. Yellow arrowheads highlight additional mesenchymal cells that do not express AGAT-1. Scale bars: 200 μm; 10 μm (zoomed images). (C) chd4(RNAi) and p53(RNAi) result in the loss of AGAT-1 expressing cells. Representative colorimetric WISH images shown at 3Fd18 of RNAi treatment. Scale bar: 200 μm. (D) Venn diagram of genes down-regulated in chd4 and p53 RNAi data sets. Timeline of RNAi treatment (Fed d0, d3, d6) and RNA collected for chd4 (yellow circles) and p53 RNAi (pink circles). Arrows highlight time points used to identify down-regulated gene set. Criteria used for genes to make the cut-off are shown. dn, down-regulated genes; p.adj, adjusted p-value; log2, fold change of RNAi over control (see Materials and methods). For the chd4 and p53 RNAi overlapping data set (587 genes), a hypergeometric distribution and a universe size of 28,668 was used to generate p-value for determining significance of overlap by chance. See also Supplementary file 1. (E) Heat map depicting candidate genes that were selected from the chd4(RNAi) and p53(RNAi) down-regulated data sets for further characterization after in situ hybridization screen. log2 fold changes in RNAi expression relative to each control time point are shown.


