. 2015 Oct 12;4:e10501. doi: 10.7554/eLife.10501

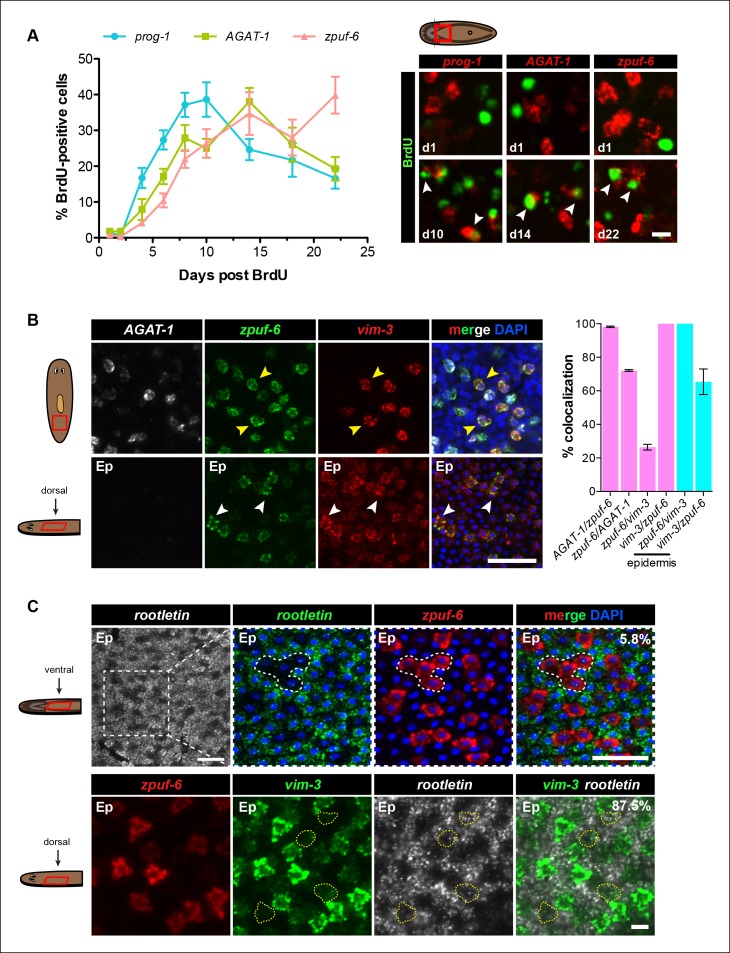
Figure 4. Zpuf-6+ epidermal cells are not terminally differentiated.

(A) Turnover dynamics for prog-1, AGAT-1 and zpuf-6 expressing cell populations. Animals were soaked with BrdU for 24 hr and chased for the indicated time periods. Quantification of the percentage of prog-1+, AGAT-1+ or zpuf-6+ cells analyzed that are BrdU+ are plotted. Error bars: SEM (see Materials and methods). Representative images of BrdU+ cells, are maximum intensity projections over 1 cell diameter of a subset of the quantified images, of the minimum and maximum time points for each gene are shown. White arrowheads highlight double-positive cells. Scale bar: 10 μm. (B) Lineage relationship between AGAT-1, zpuf-6 and vim-3. Top row: Triple FISH showing overlapping expression between AGAT-1, zpuf-6 and vim-3 in the mesenchyme. Yellow arrowheads highlight cells that are zpuf-6+ vim3+ AGAT-1neg. AGAT-1 and vim-3 exhibit little to no co-expression (Figure 2B). Bottom row: Dorsal epidermal (Ep) view of zpuf-6 and vim-3. White arrowheads highlight cells that co-express zpuf-6 and vim-3 but there are additional cells expressing vim-3. Images are single confocal planes. Scale bar: 50 μm. Quantifications of the percent colocalizations of combinations of AGAT-1, zpuf-6 and vim-3 mesenchymal (magenta) and zpuf-6 and vim-3 dorsal epidermal cells (cyan) are shown (∼200-400 cells were quantified over >3 animals; error bars: SD). Gene1/gene2 notation signifies percentage of gene1+ cells that are also positive for gene2 expression. Notable percentages: zpuf-6+/AGAT-1+ (72%), zpuf-6+/vim-3+ (26%). (C) zpuf-6+ epidermal cells express very low levels of rootletin. Top row: double FISH of rootletin and zpuf-6. 5.8%=percentage of strong zpuf-6+ epidermal cells that co-express rootletin (~300 cells). Scale bars: 50 μm. Bottom row: triple FISH of zpuf-6, vim-3 and rootletin in dorsal epidermis. Only overlay of vim-3 and rootletin is shown (far right panel). Yellow-dashed shapes outline cells that express very low levels of vim-3 that also express rootletin. 87.5%=percentage of weak vim-3+ dorsal epidermal cells that co-express rootletin (~200 cells). Images are single confocal planes. Scale bar: 10 μm.

DOI: http://dx.doi.org/10.7554/eLife.10501.012

Figure 4.

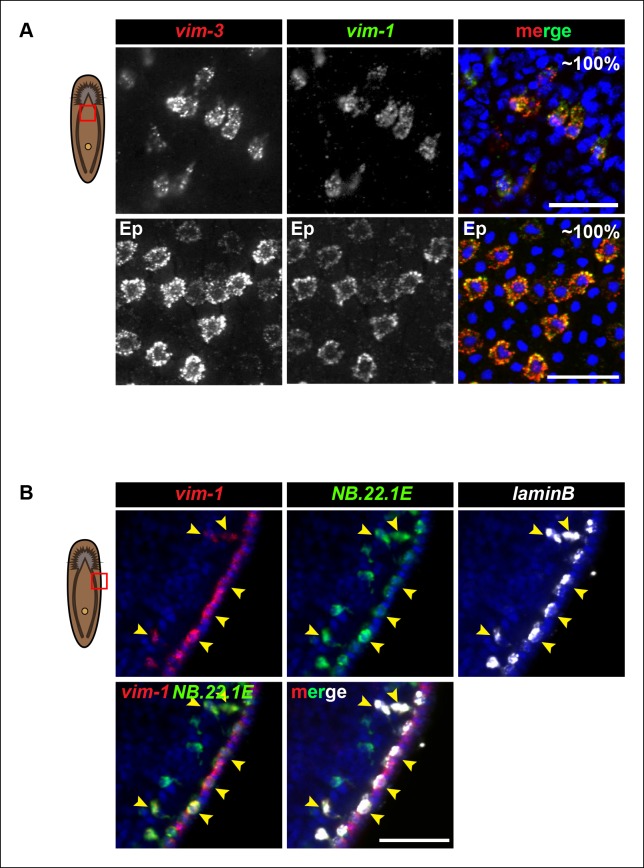
Figure 4—figure supplement 1. Vim-3 and vim-1 are co-expressed in the same cell types.

Figure 4—figure supplement 1.

(A) Images represent single confocal planes from ventral anterior regions of the mesenchyme (top panels) and epidermis (Ep) (bottom panels). Percentages represent fraction of vim-3+ cells that co-express vim-1 (∼200 mesenchymal cells and 400 epidermal cells were quantified). Scale bars: 50 μm. (B) Vim-1/vim-3 is expressed in NB.22.1E+ and laminB+ cells at the animal body margin (yellow arrowheads). Images represent single confocal planes. Scale bar: 50 μm.
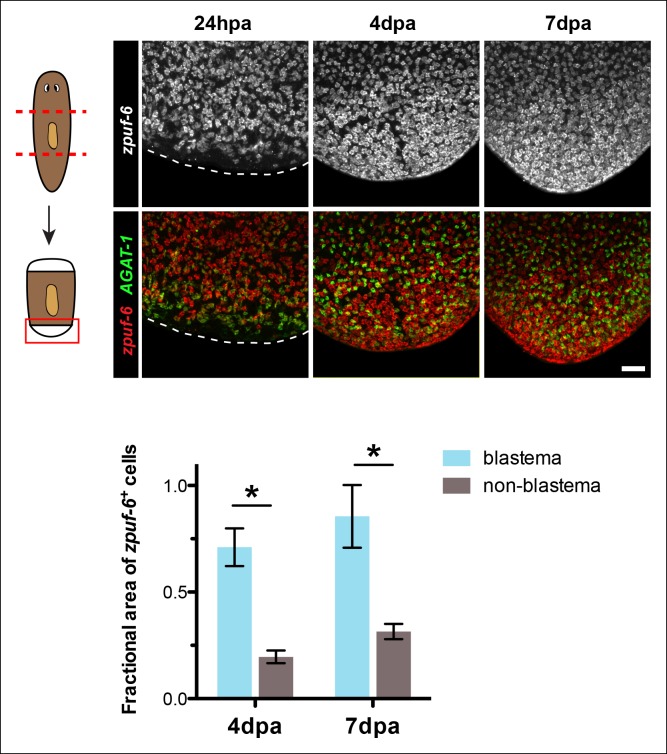
Figure 4—figure supplement 2. zpuf-6+ cells are enriched at regenerating blastemas.

Figure 4—figure supplement 2.

Shown are posterior trunk fragments cut from wild-type animals and regenerated for the indicated times: hours or days post-amputation (hpa and dpa, respectively) and subjected to double FISH with zpuf-6 and AGAT-1. Dotted lines demarcate the posterior end of the animal. Maximum intensity projections are shown. Scale bar: 100 μm. Quantification of the fractional area of zpuf-6+ cells in the regenerating blastema compared to non-blastema (old tissue). The overall positive signal of zpuf-6+ cells was measured in a fixed region in the blastema compared to the same area in the non-blastema region. Data represent means from 2 regenerating trunk fragments for each time point; error bars: SD. Student's t test: *, p < 0.05.
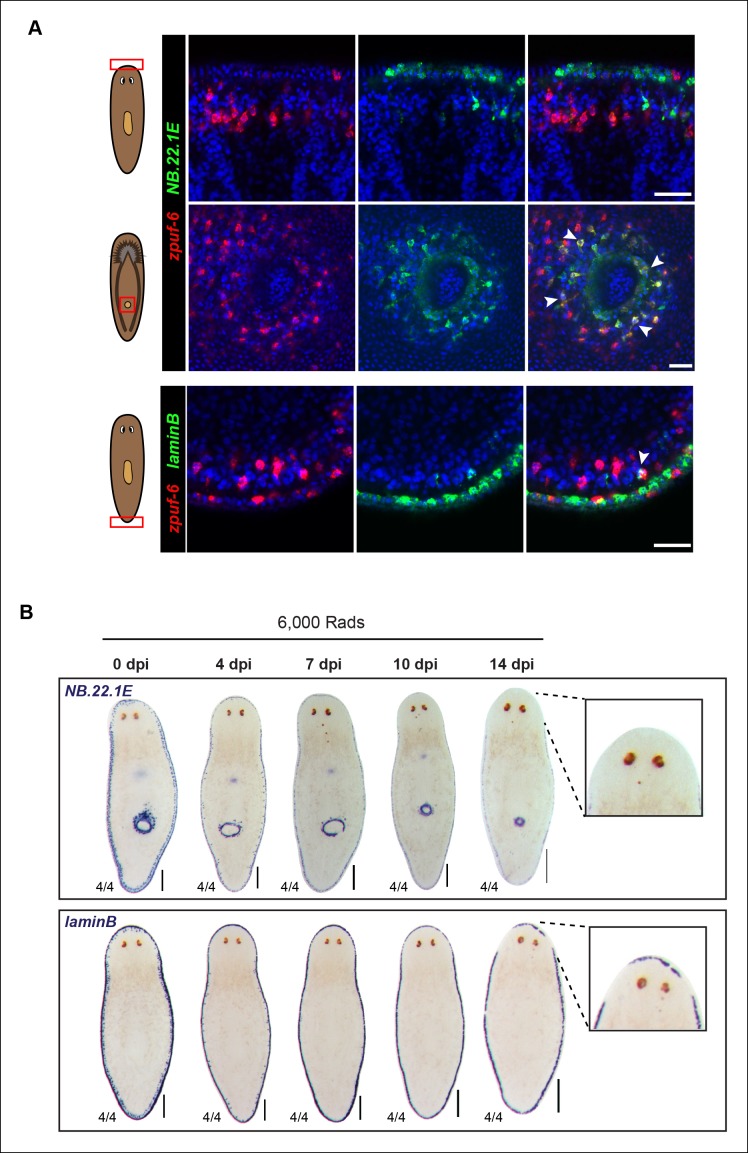
Figure 4—figure supplement 3. NB.22.1E+ and laminB+ cells exhibit little overlap with zpuf-6 and display slow cell turnover kinetics after irradiation.

Figure 4—figure supplement 3.

(A) Whole-mount FISH of zpuf-6 and markers of epidermal edge cells (NB.22.1E and laminB). zpuf-6 exhibits little to no overlap with NB.22.1E in edge cells (top row) but overlaps with NB.22.1E+ epidermal cells surrounding the ventral mouth opening (middle row, white arrowheads). zpuf-6 shows very little overlap with laminB+ edge cells (bottom row, white arrowheads). Scale bars: 50 μm. (B) Colorimetric WISH of animals after 6,000 Rad irradiation exposure for markers NB.22.1E and laminB. By 14dpi (days post-irradiation), cells around the anterior have disappeared, suggesting that these cells do not turnover as quickly as zpuf-6+ epidermal cells. For NB.22.1E marker, sub-epithelial mesenchymal cells and those around the ventral mouth opening disappear by 7dpi, suggesting they turn over more rapidly than the cells at animal margin. Ventral views. Scale bars: 200 μm.