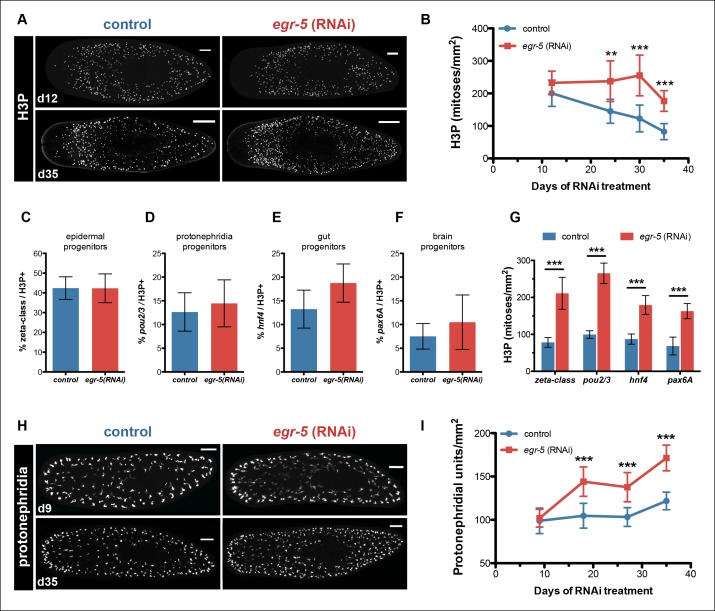
Figure 6. Egr-5 knockdown results in the expansion of multiple progenitor populations.
(A,B) egr-5 knockdown causes an increase in global stem cell proliferation. (A) H3P-positive cells over the surface area in control and egr-5(RNAi) intact animals (8 feedings). Maximum intensity projections of representative H3P patterns for day 12 and day 35 time points are shown. Scale bar: 200 μm. (B) Quantification of H3P-positive cells per surface area from (A). Data represent means, error bars: SD. Student's t test: **, p <0.005, ***, p <0.0001. (C–G) Stem cell proliferation results in the expansion of multiple lineage-committed progenitors. For control and egr-5(RNAi) animals (3Fd27), animals were fixed and stained for H3P and a marker for the following: (C) dividing epithelial progenitors (zeta class: zfp-1, egr-1, fgfr-1), (D) dividing protonephridia progenitors (pou2/3), (E) dividing gut progenitors (hnf4), and (F) dividing brain progenitors (pax6A). Quantifications of percentage of lineage-committed progenitors of total H3P+ cells are shown. Error bars: SD. (G) Quantification of total mitotic cells (H3P) per surface area for control and egr-5(RNAi) animals (3Fd27) from analysis in (C–F). Data represent means, error bars: SD. Student’s t test: ***, p <0.0001. (H,I) egr-5 knockdown causes supernumerary protonephridial units (PU). (H) Control and egr-5(RNAi) intact animals (8 feedings) were stained for the number of proximal units (slc6a-13) to visualize and quantify total PUs. Maximum intensity projections of representative animals for day 9 and day 35 time points are shown. Scale bar: 200 μm. (I) Quantification of PU per surface area. Data represent means, error bars: SD. Student's t test: ***, p <0.0001.


