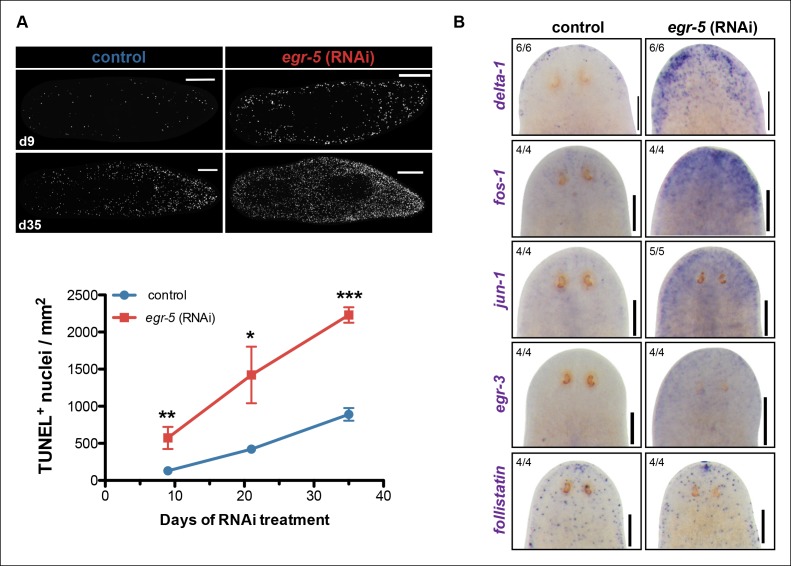
Figure 7. A global stress response is induced by loss of egr-5.
(A) Whole-mount TUNEL assay measuring apoptosis in control and egr-5(RNAi) animals (8 feedings). Quantification of TUNEL-positive nuclei per surface area is plotted. Data represent means; error bars: SEM. Student's t test: *, p <.05, **, p <.005, ***, p <.0001. Representative maximum intensity projection of TUNEL-stained image for day 9 and day 35 are shown. Scale bars: 200 μm. (B) Wound-induced genes are up-regulated in egr-5(RNAi) animals. Representative colorimetric WISH images of delta-1, fos-1, jun-1 egr-3 and follistatin expression in the anterior regions of intact control and egr-5(RNAi) animals at 4Fd21 of RNAi treatment. Scale bars: 200 μm.


